
The Molecular Profiling Homepage
Role: Design lead | Team: PM, 2-3 engineers, clinical lead | Timeline: March 2023 -present [though not consecutively]
Visualizing life-saving data
The Molecular Profiling Homepage (MPH) is a dedicated page within OncoEMR, Flatiron Health’s flagship electronic medical records product, that gives oncology providers structured, harmonized access to their patients' molecular profiling results. This data, which is crucial to making treatment decisions for cancer patients, currently exists only as fragmented PDF reports from external labs. By making these results readable by the patient chart and organizing them in a single, navigable location, the MPH enables clinicians to more confidently interpret genomic data and select the right treatments.
I led UX strategy, research, and design for this project across multiple phases spanning 2022 to present, navigating shifting priorities, engineering constraints, and a limited beta launch.
Where we are now
The MPH completed a successful beta with five cancer providers. It has been recognized as a foundational piece of Flatiron’s larger clinical decision support strategy for unifying the precision medicine experience within OncoEMR. I'm leading the design strategy for this work across three product teams with the goal of integrating patient identification, test ordering, and results interpretation into a cohesive experience. Before we expand, we're working through data quality and process requirements needed to scale responsibly. A broader rollout is planned once those are resolved.
Curiosity
Molecular profiling tests are crucial for making decision about patient care, but ordering them is only half the battle. Results come back as a PDF report, and each lab has their own standards for displaying results. Clinicians have to learn to interpret these results and decide what is relevant for their patient's case.
To make things more complicated, these PDF reports are 'unstructured,' meaning the data they contain can't be read by the patient chart. In order to record the results as part of their treatment decision or use them in other workflows, providers need to manually enter them anywhere in the chart that they want to use the data.
To make these results more accessible and easier to interpret for the clinician, two things need to be true:
(1) The results need to be structured: In order to maximize utility of the data, the patient chart needs to be able to 'read' the data and integrate it into the appropriate workflows or the overall picture of the patient's disease
(2) The results need to be harmonized: Each lab has a unique way of displaying or interpreting the results of these tests. Clinicians that use more than one lab to test patients at their practice need to become experts in interpreting each of the results PDFs so that they can make the appropriate treatment decisions.
If we can solve both of these problems, we can give physicians easy access to all the relevant molecular results without having to manually interpret or enter data when making a targeted treatment decision.
Research
I led 2 rounds of research for this work, both discovery and evaluative. We approached our discovery research with the frame of how we could surface structured genomic data in the patient chart.
Participants | 3 MDs who lead teams at external practices
Timeline | May-June 2022
Insights
-
Providers need to be able to analyze biomarker results alongside other aspects of the patient's case in order to make an informed decision. Going between different PDF reports and other fragmented sources of information in the patient chart is frustrating
-
Inputting genomic data requires manual entry, which is time consuming, tedious, and may lead to human error.
-
Genomic data is captured using different notation styles and language across the patient chart. Without standards for how this appears, in OncoEMR, it's difficult to know what the source of truth is or how to accurately record what the results are
-
Relevant genomic and biomarker data lives in inconvenient pages or workflows in the patient chart, making it hard to access for use at optimal points during the clinician's decision-making process
Creativity
Our initial conversations did not make the concept of a separate 'page' within the patient chart the obvious choice. Initially, I wanted to explore displaying the results of molecular profiling tests in locations in the chart that the provider already frequented rather than asking them to develop a new workflow for analyzing results. There were three obvious places where these results could show up:
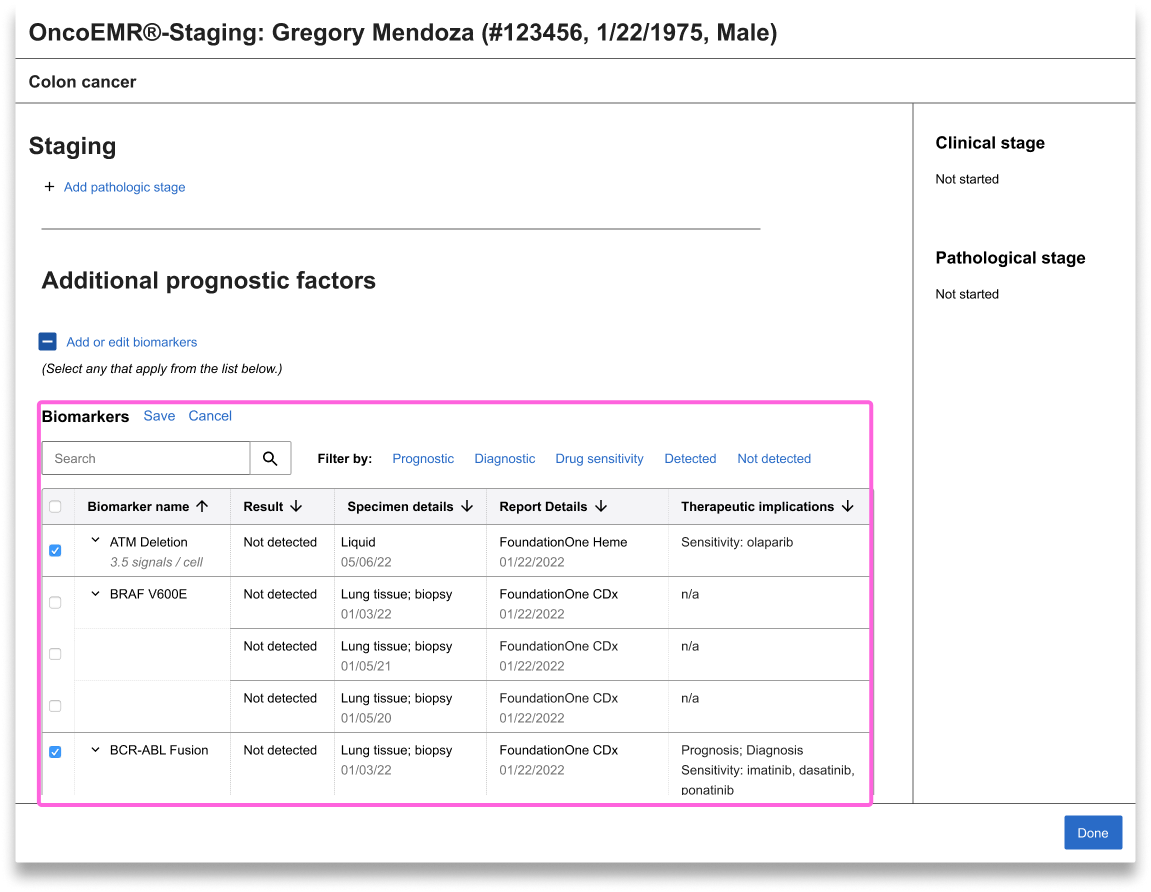
Staging
When a patient is diagnosed with a specific disease, say, lung cancer, that diagnosis must be staged in order for the provider to know how to treat it. In a nutshell, the stage indicates how severe the patient's cancer is. While each disease has unique staging requirements, biomarker results both inform initial staging and diagnosis and the progression of the disease. Currently, OncoEMR is designed so that there is a space for providers to manually input biomarker results at the same time that they are staging the patient. However, these inputs are often left blank because of how cumbersome manual inputs are.
One of my initial explorations suggested surfacing the biomarker results from lab integrations in the staging workflow itself so that providers could select the ones they wanted to include rather than having to type them in.
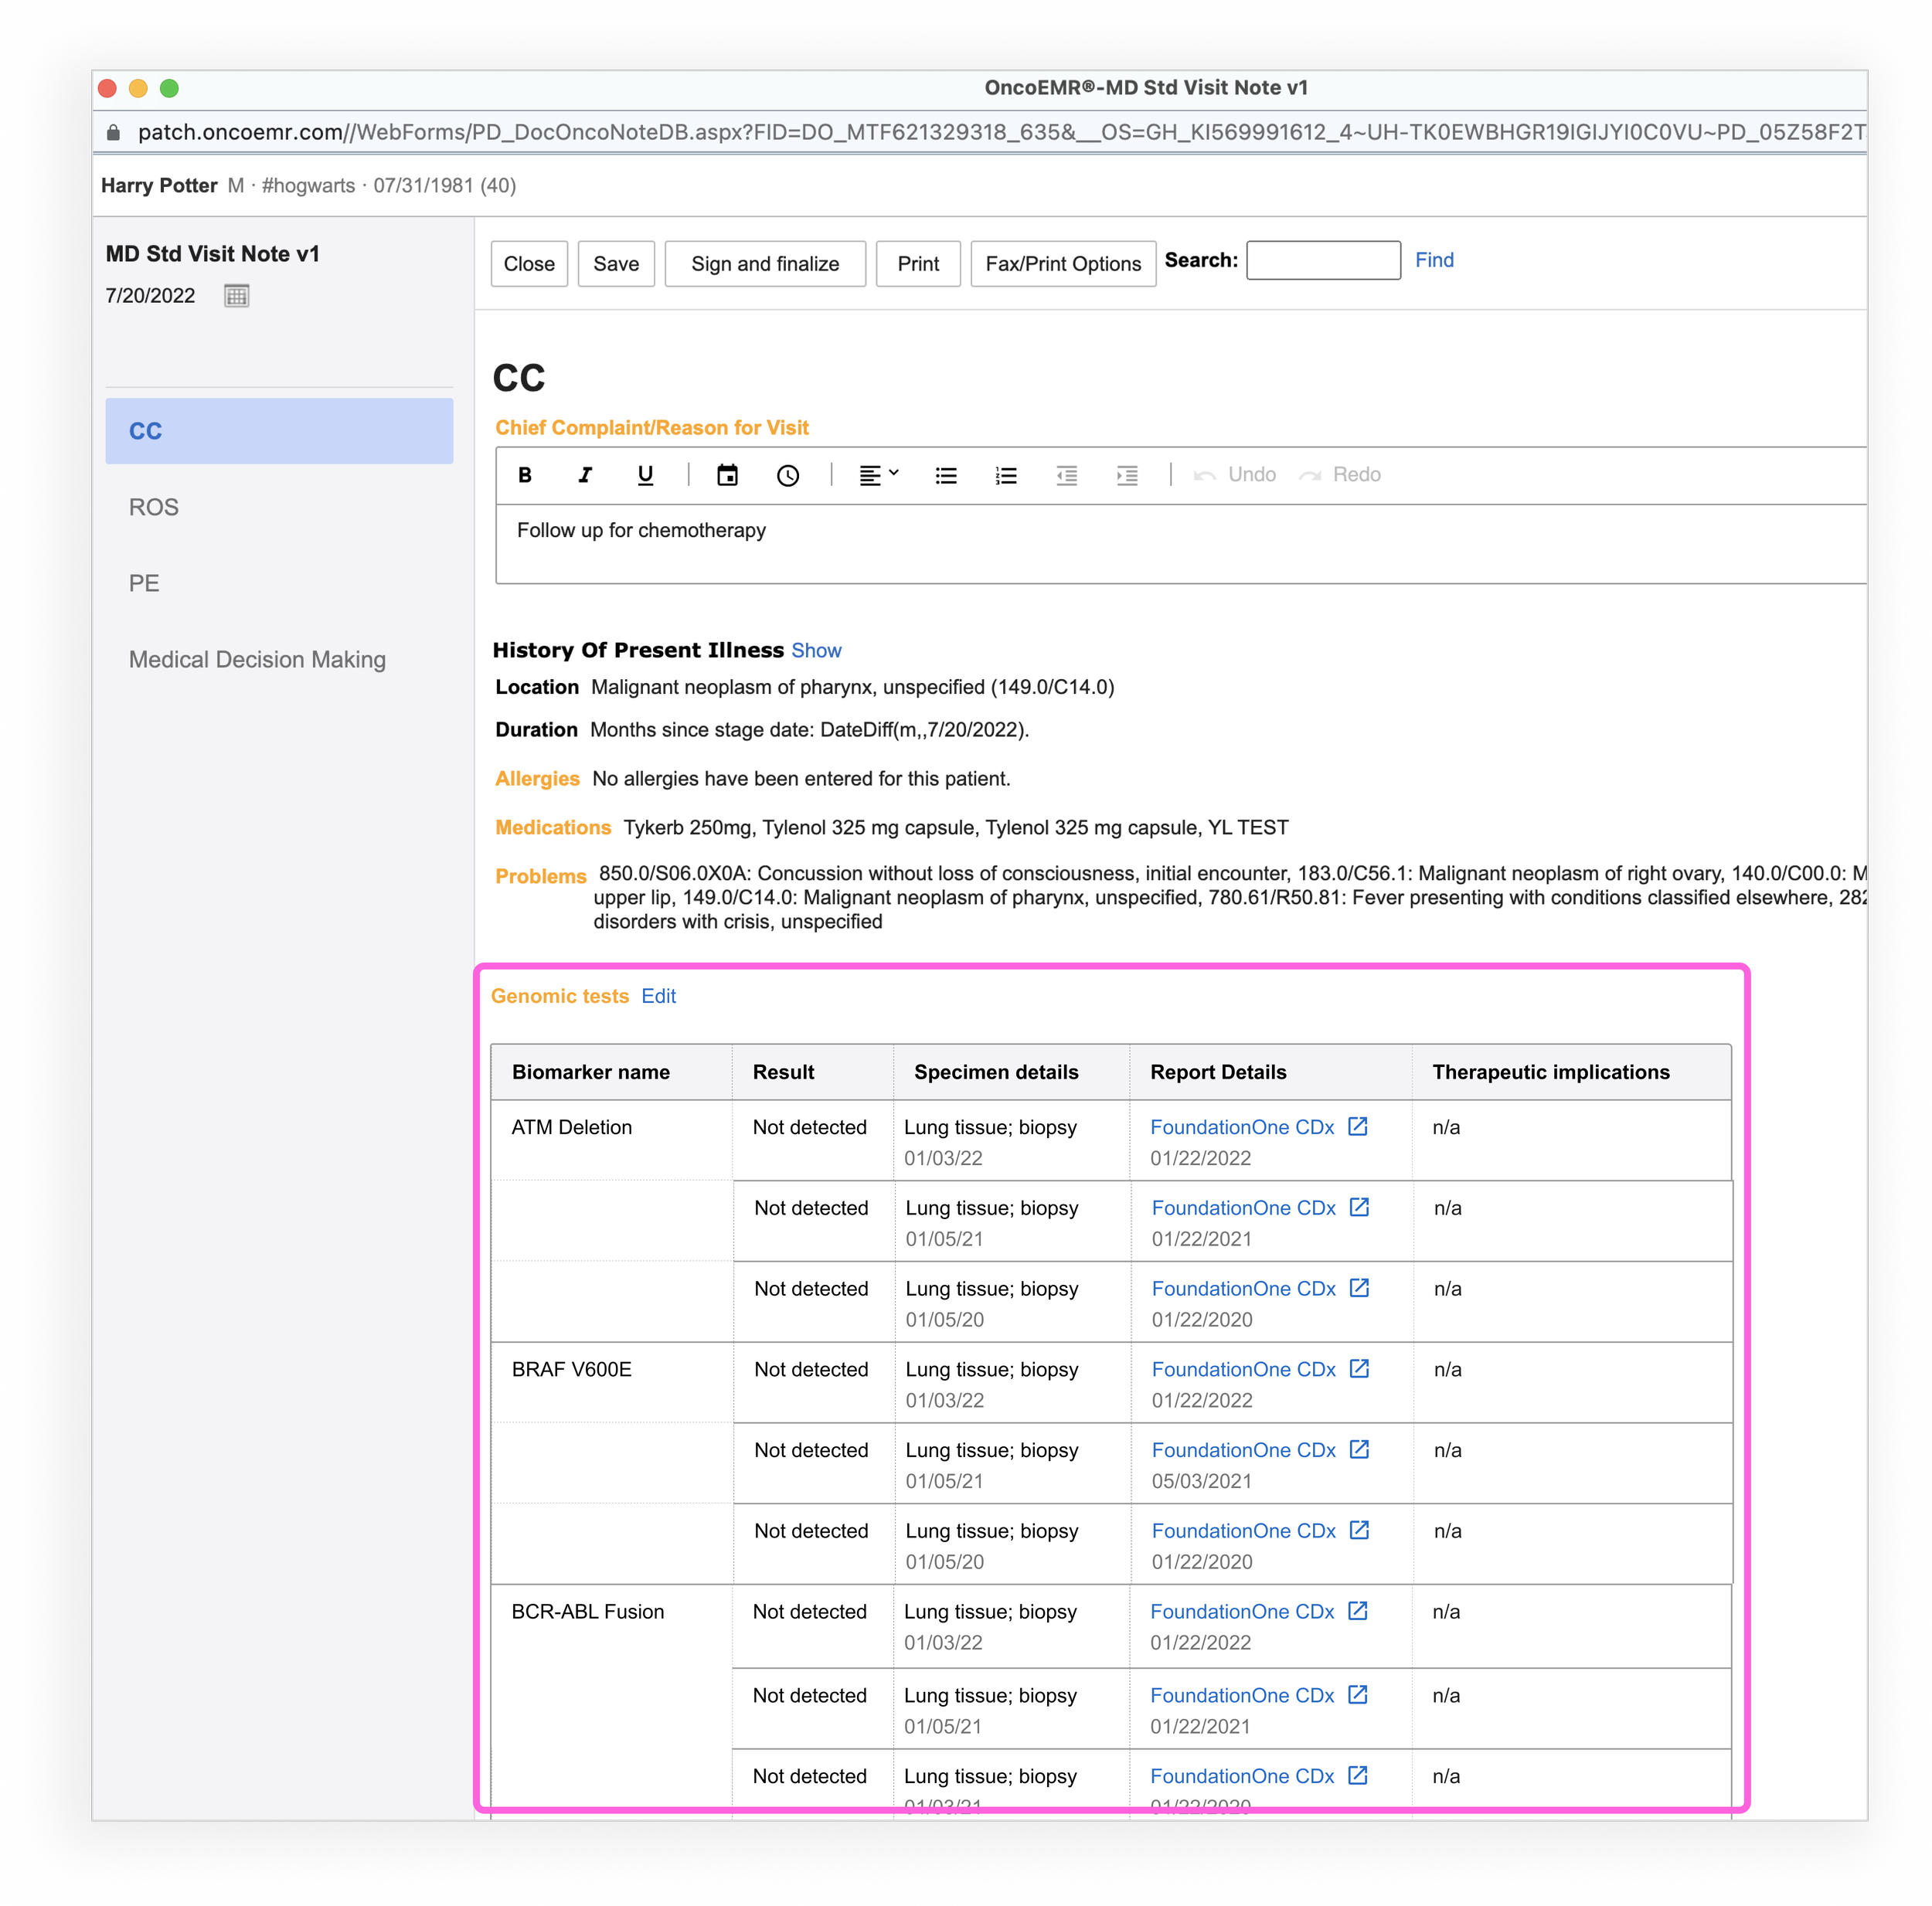
The visit note
If you ask providers what their source of truth is when it comes to information about each of their patients, most will point you to the visit note. This is the living document where providers summarize patient encounters, document disease progression and record treatment decisions. When other parts of the patient chart are out of date, you can usually count on the note to be current and correct. Given that most providers go from analyzing molecular profiling results to recording their decision in the note, it seemed like a logical place to surface the results.
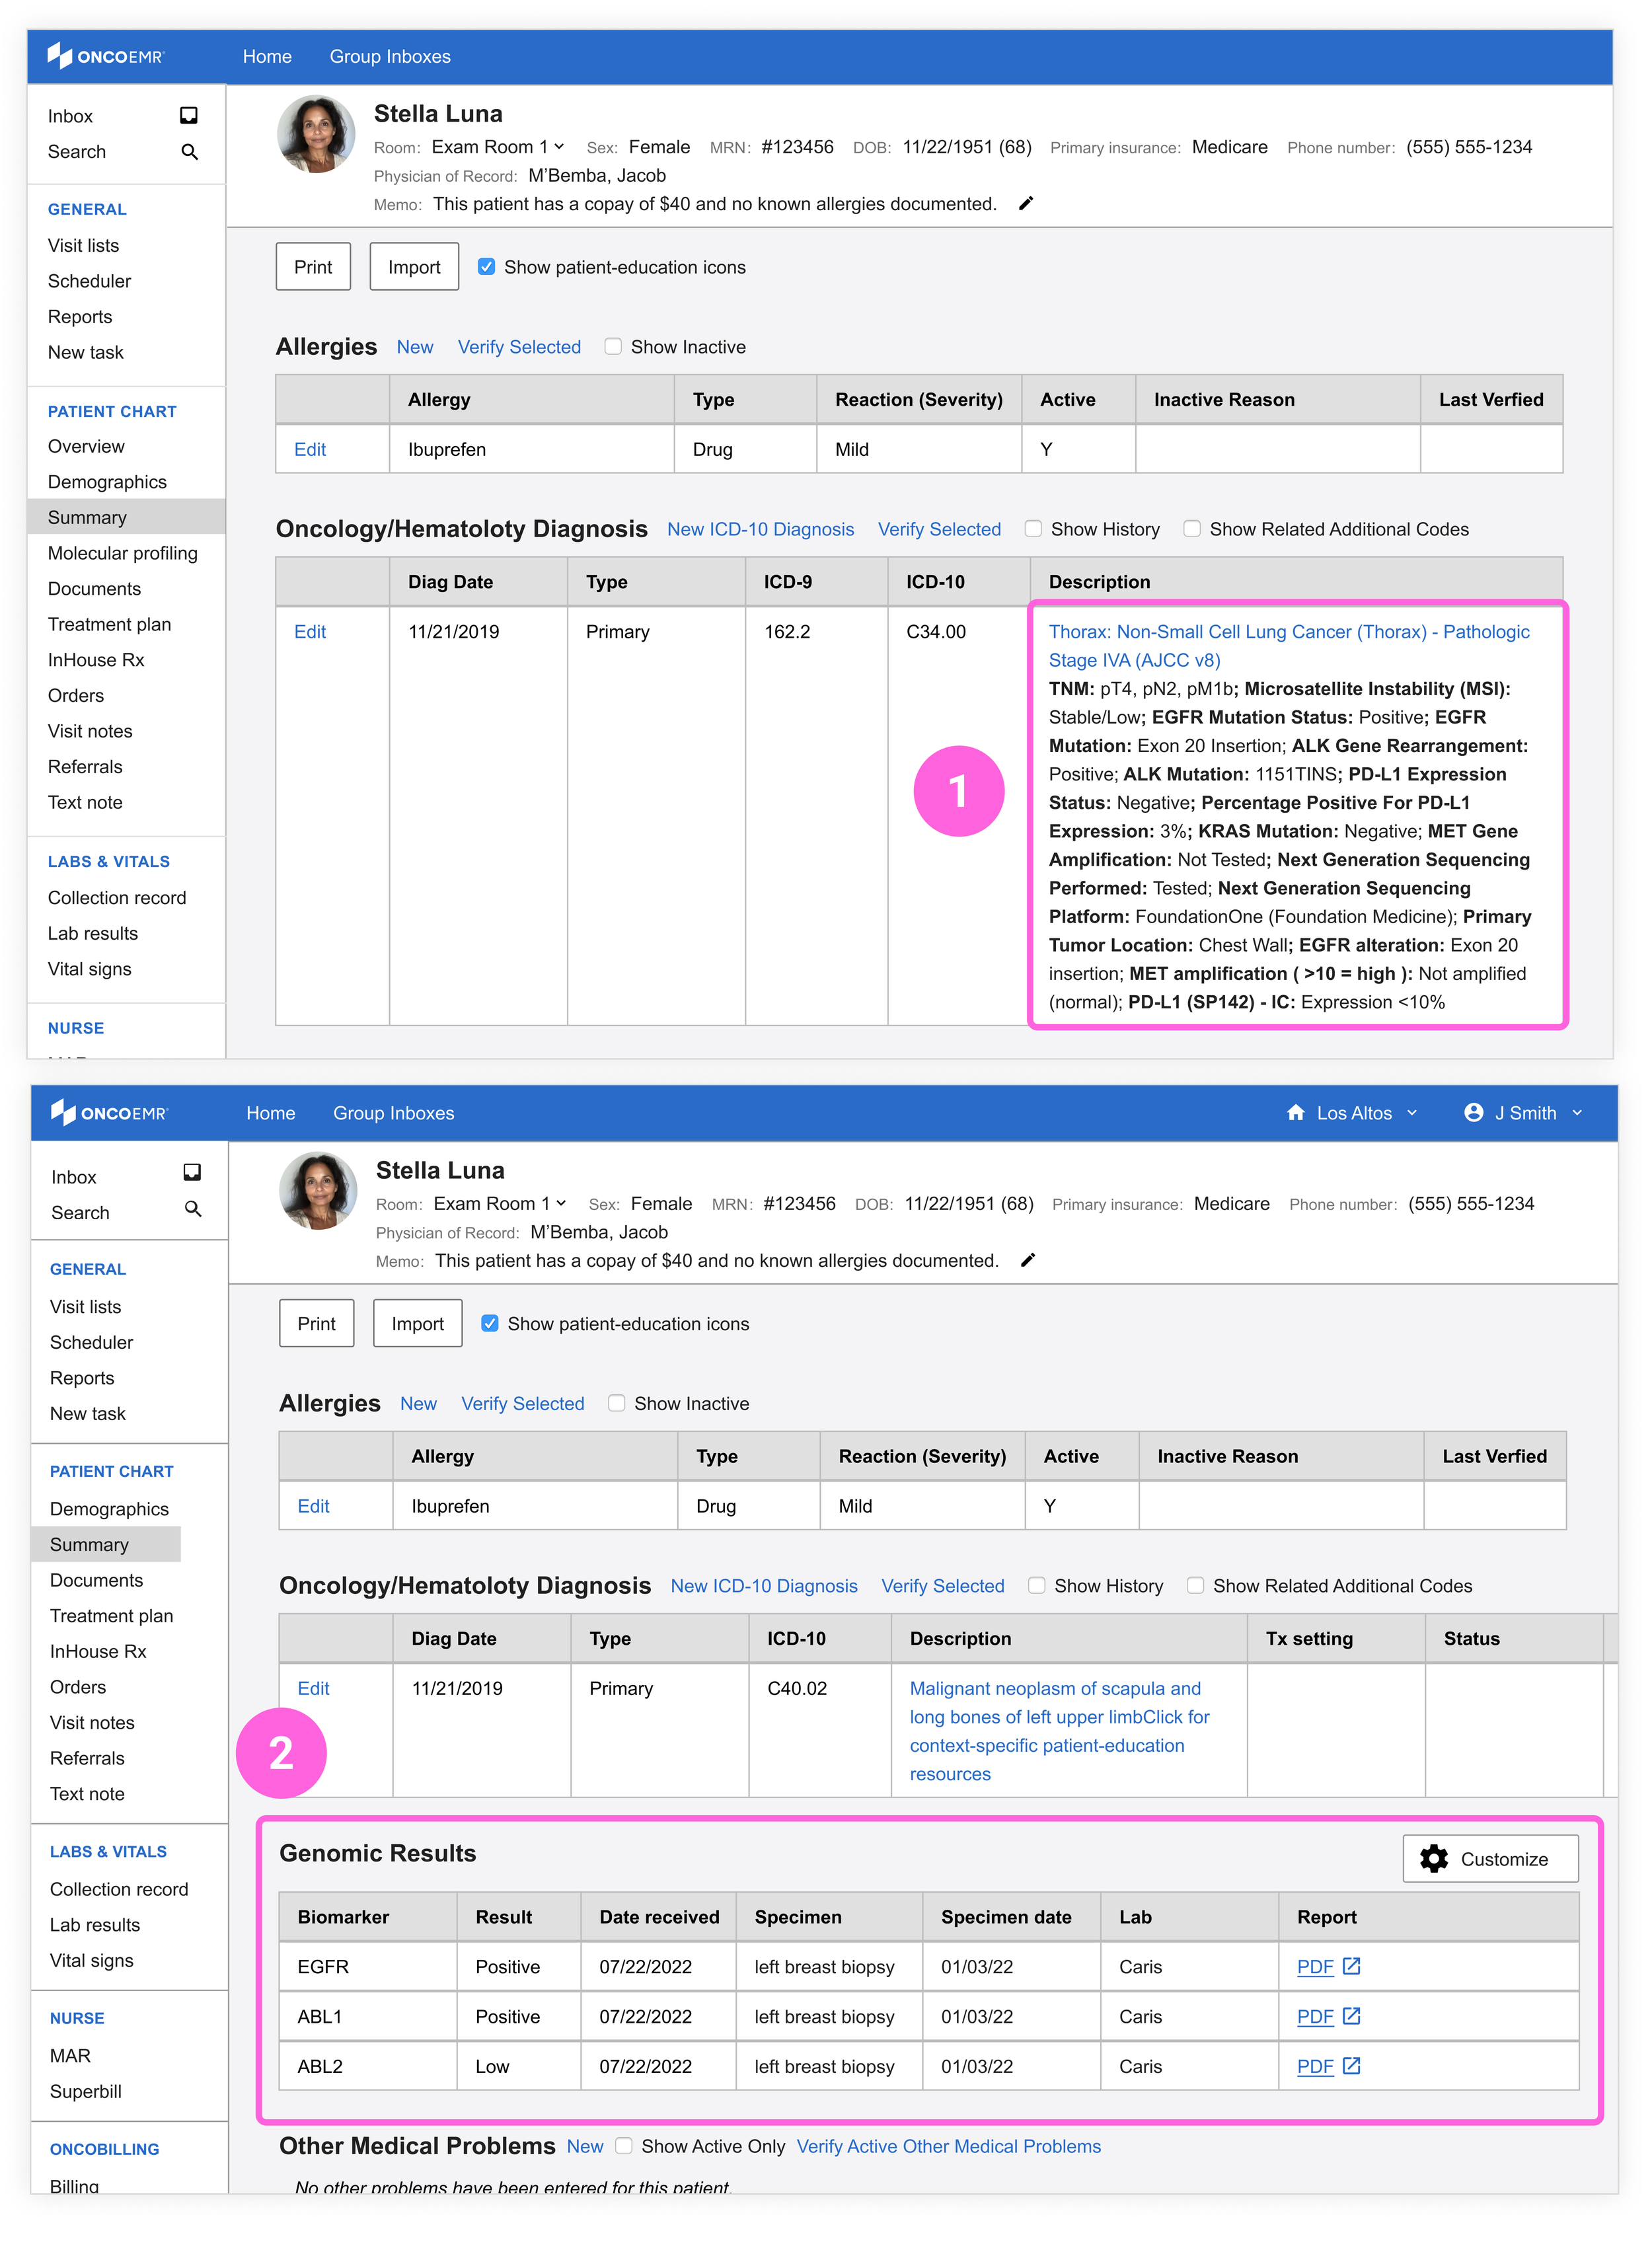
The Summary page
This page in the chart contains an overview of the patient's disease information and medical problems include the detailed diagnosis itself. If any biomarkers have been manually recorded, they will show up in the summary page.
(1) The first design explores what it would look like to add the biomarker results from the report into the description of the table that records the patient's diagnosis. The description already contains the name of the patient's disease and the stage. Adding the biomarkers here would provide a more accurate and immediate picture of the patient's case.
(2) In an attempt to make the pattern more scalable, I also tried adding a unique table to the summary page to contain results and relevant details about each biomarker.
What users said
I led an second round of evaluative research showing providers these ideas for how to surface molecular profiling results in the patient chart. Their feedback ultimately set me on the path towards having a unique molecular profiling page.
Participants | 7 MDs and one pathologist from 7 practices
Timeline | August 2022
“The page where we have staging and manual inputs… I can’t say that I’m confident that every clinician would be doing that so I’m not relying on that as a source of information.”
“I love the idea of having all the results in kind of a neat, legible way in the note. The only other thing I worry about is clutter”
“I like that. All the information we would see on a pdf would be displayed here[...] I think this is a really useful way of clustering the data”
Staging
The providers we spoke to assured us that they don't like to spend a lot of time in the staging workflow, and it certainly isn't a place that they want to have to return to in order to analyze new information. They use this space mostly for documentation, and while it might be important to make sure biomarkers eventually make it here, it should not be the first line of defense
The visit note
While having the results in the note was desirable, providers like their note to be 'clean.' Out of the hundreds of potential results a patient may have, only a few will be worth documenting. Providers reported not wanting to have to manually curate these results in the note itself. Rather, they'd prefer to be able to import the ones they want easily from another source.
The summary page
Seeing the table in the summary page got closest to what providers thought would be more useful, but it brought up a number of questions they wanted solved for: With the possibility of hundreds of results, how should these biomarkers be organized and prioritized? What metadata should be included? What about search-ability?
Creating the Molecular Profiling Homepage
Based on the feedback we received for the initial explorations, it was clear that providers wanted to be able to analyze and curate the molecular profiling results in a way that made sense for each of their individual workflows. Neither staging nor the visit note or summary pages were ideal places for this kind of work to take place. A unique page would give us the opportunity to pressure test multiple ways to display the data and give providers a range of options for how to work it into their process.
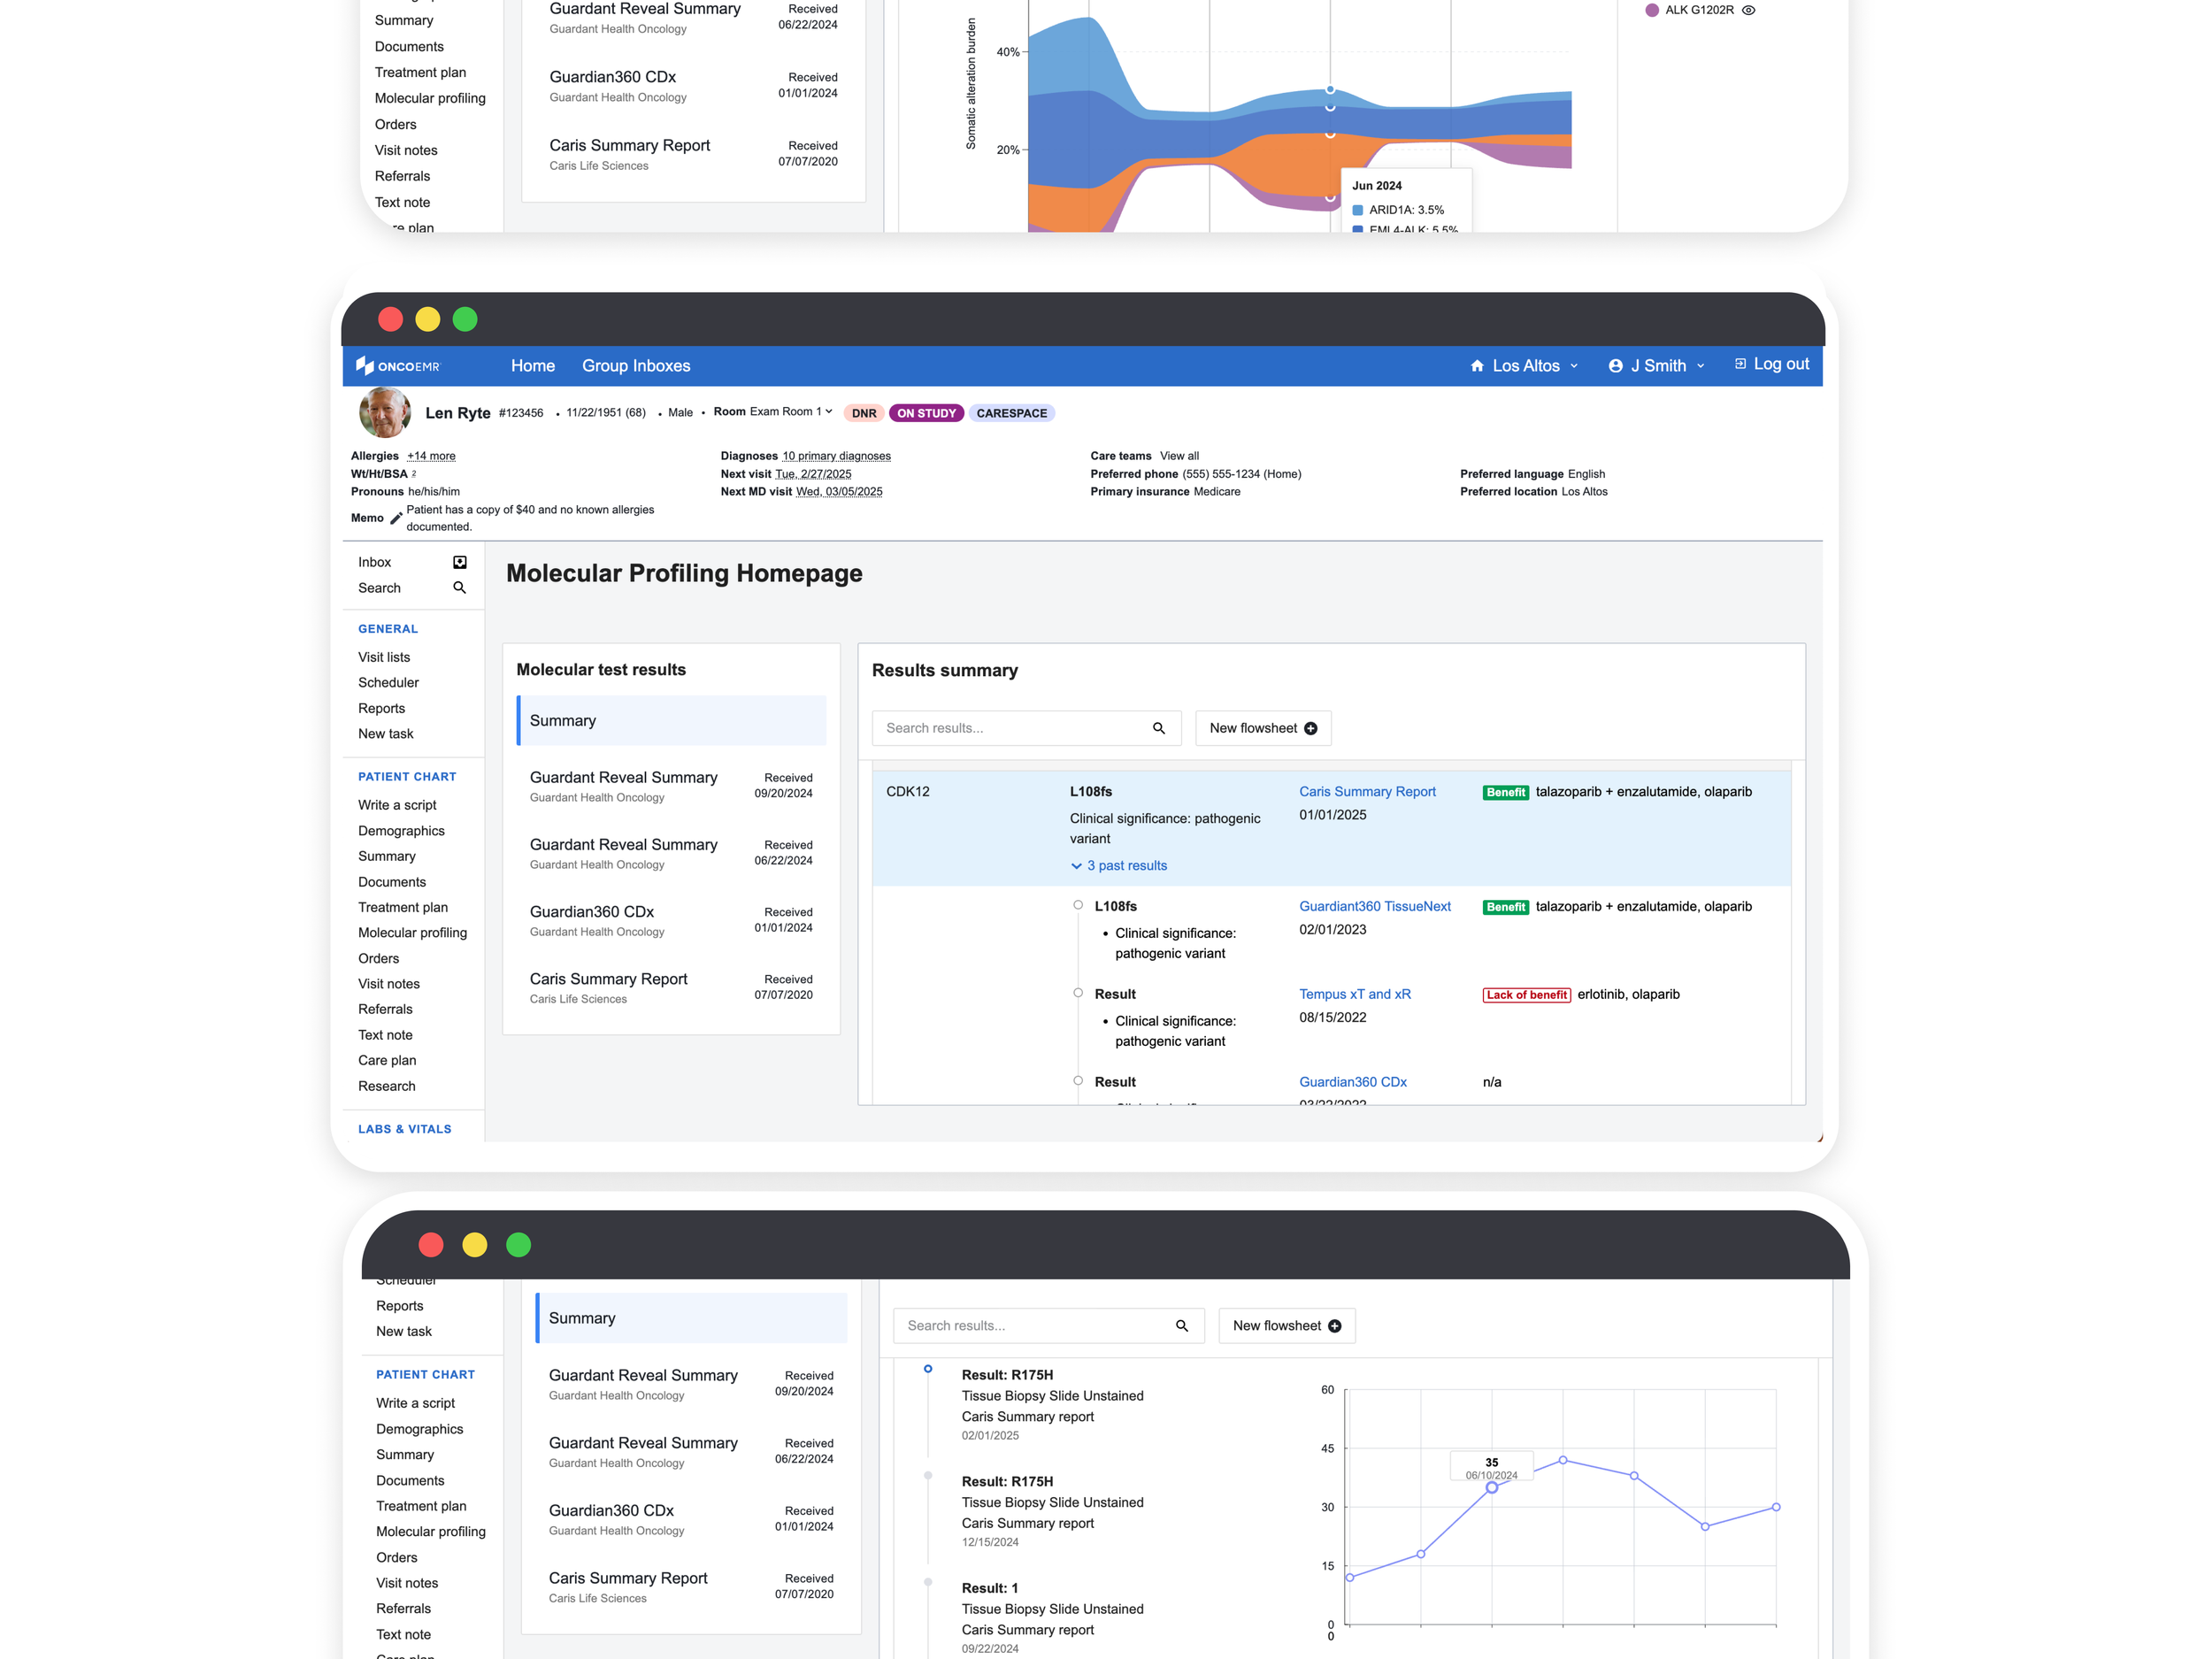
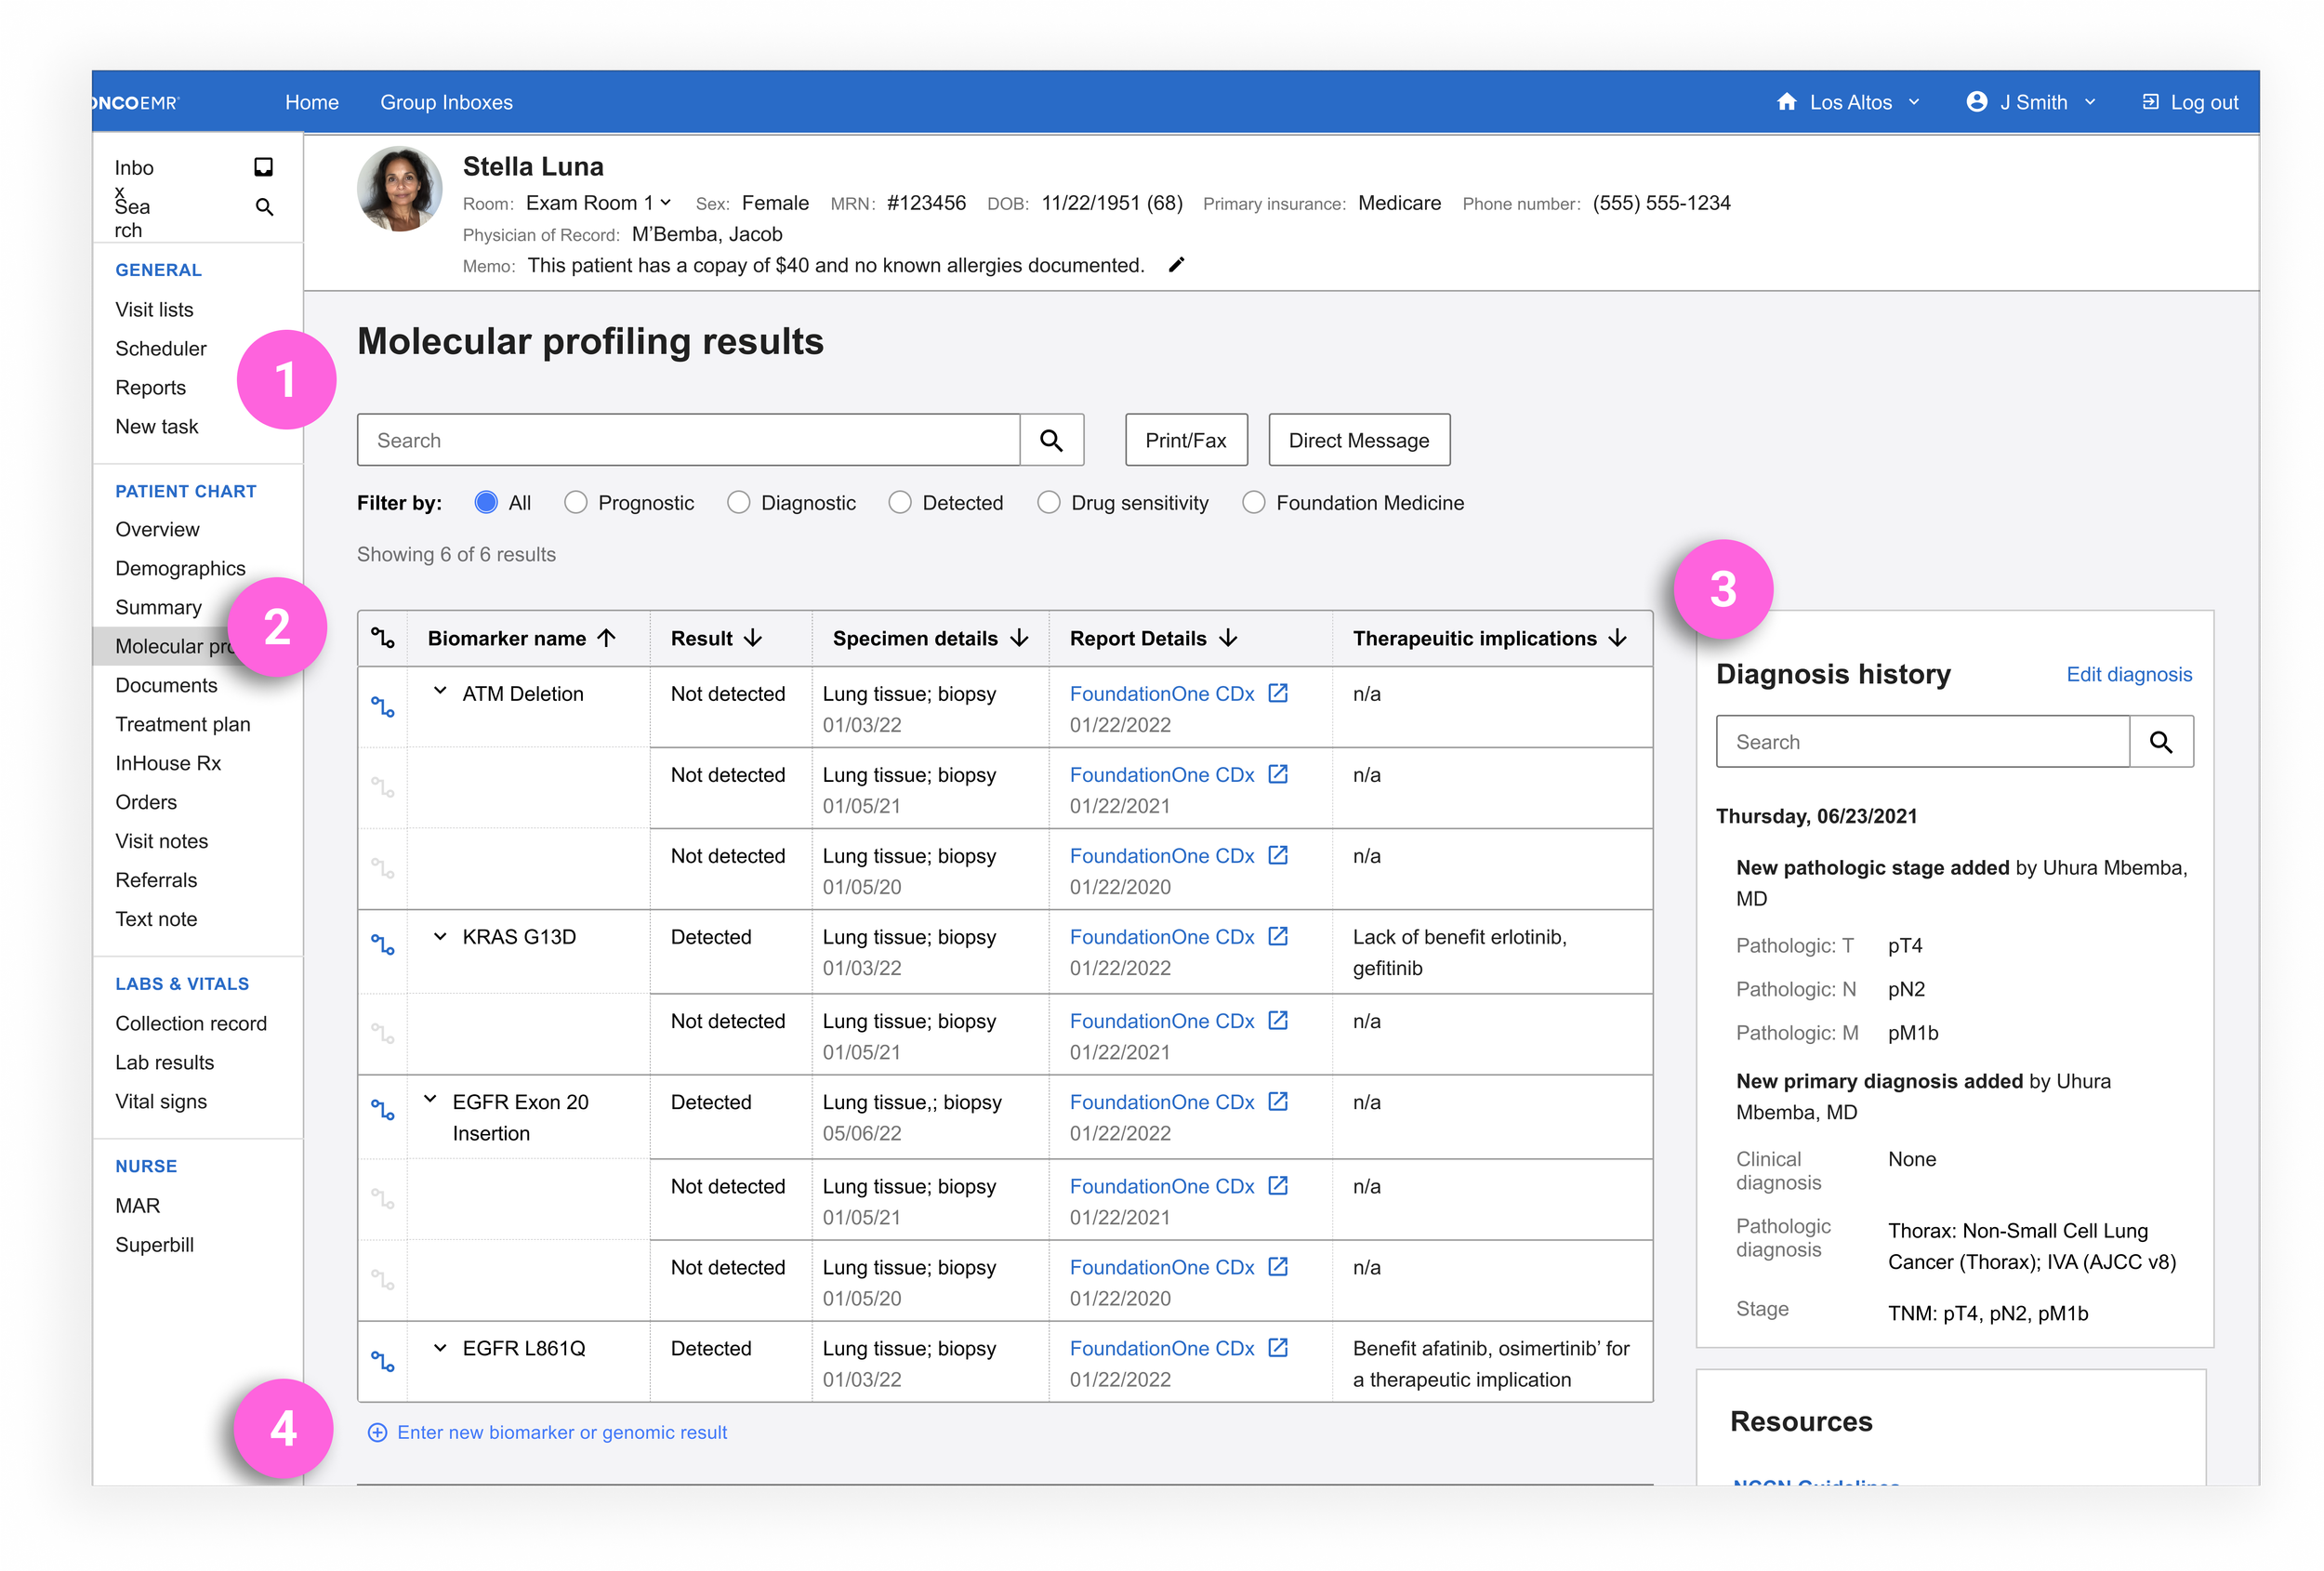
My first iteration took the 'throw everything at the wall' approach in an effort to address all the pain points we'd heard. I wanted to maximize our options and then have users and our clinical team help pull it back into what looked more like an MVP.
(1) Filter and Search: Flexible ways for providers to curate which biomarkers they want to see
(2) Biomarker table: Structured biomarker results surfaced with actionable therapeutic implications and relevant metadata like the biopsy, history of results (if applicable) and the original report
(3) Diagnosis history: Understand the patient's diagnosis and any relevant changes without leaving the page
(4) Enter new result: The ability to add manually any results that may not have made it into the patient chart
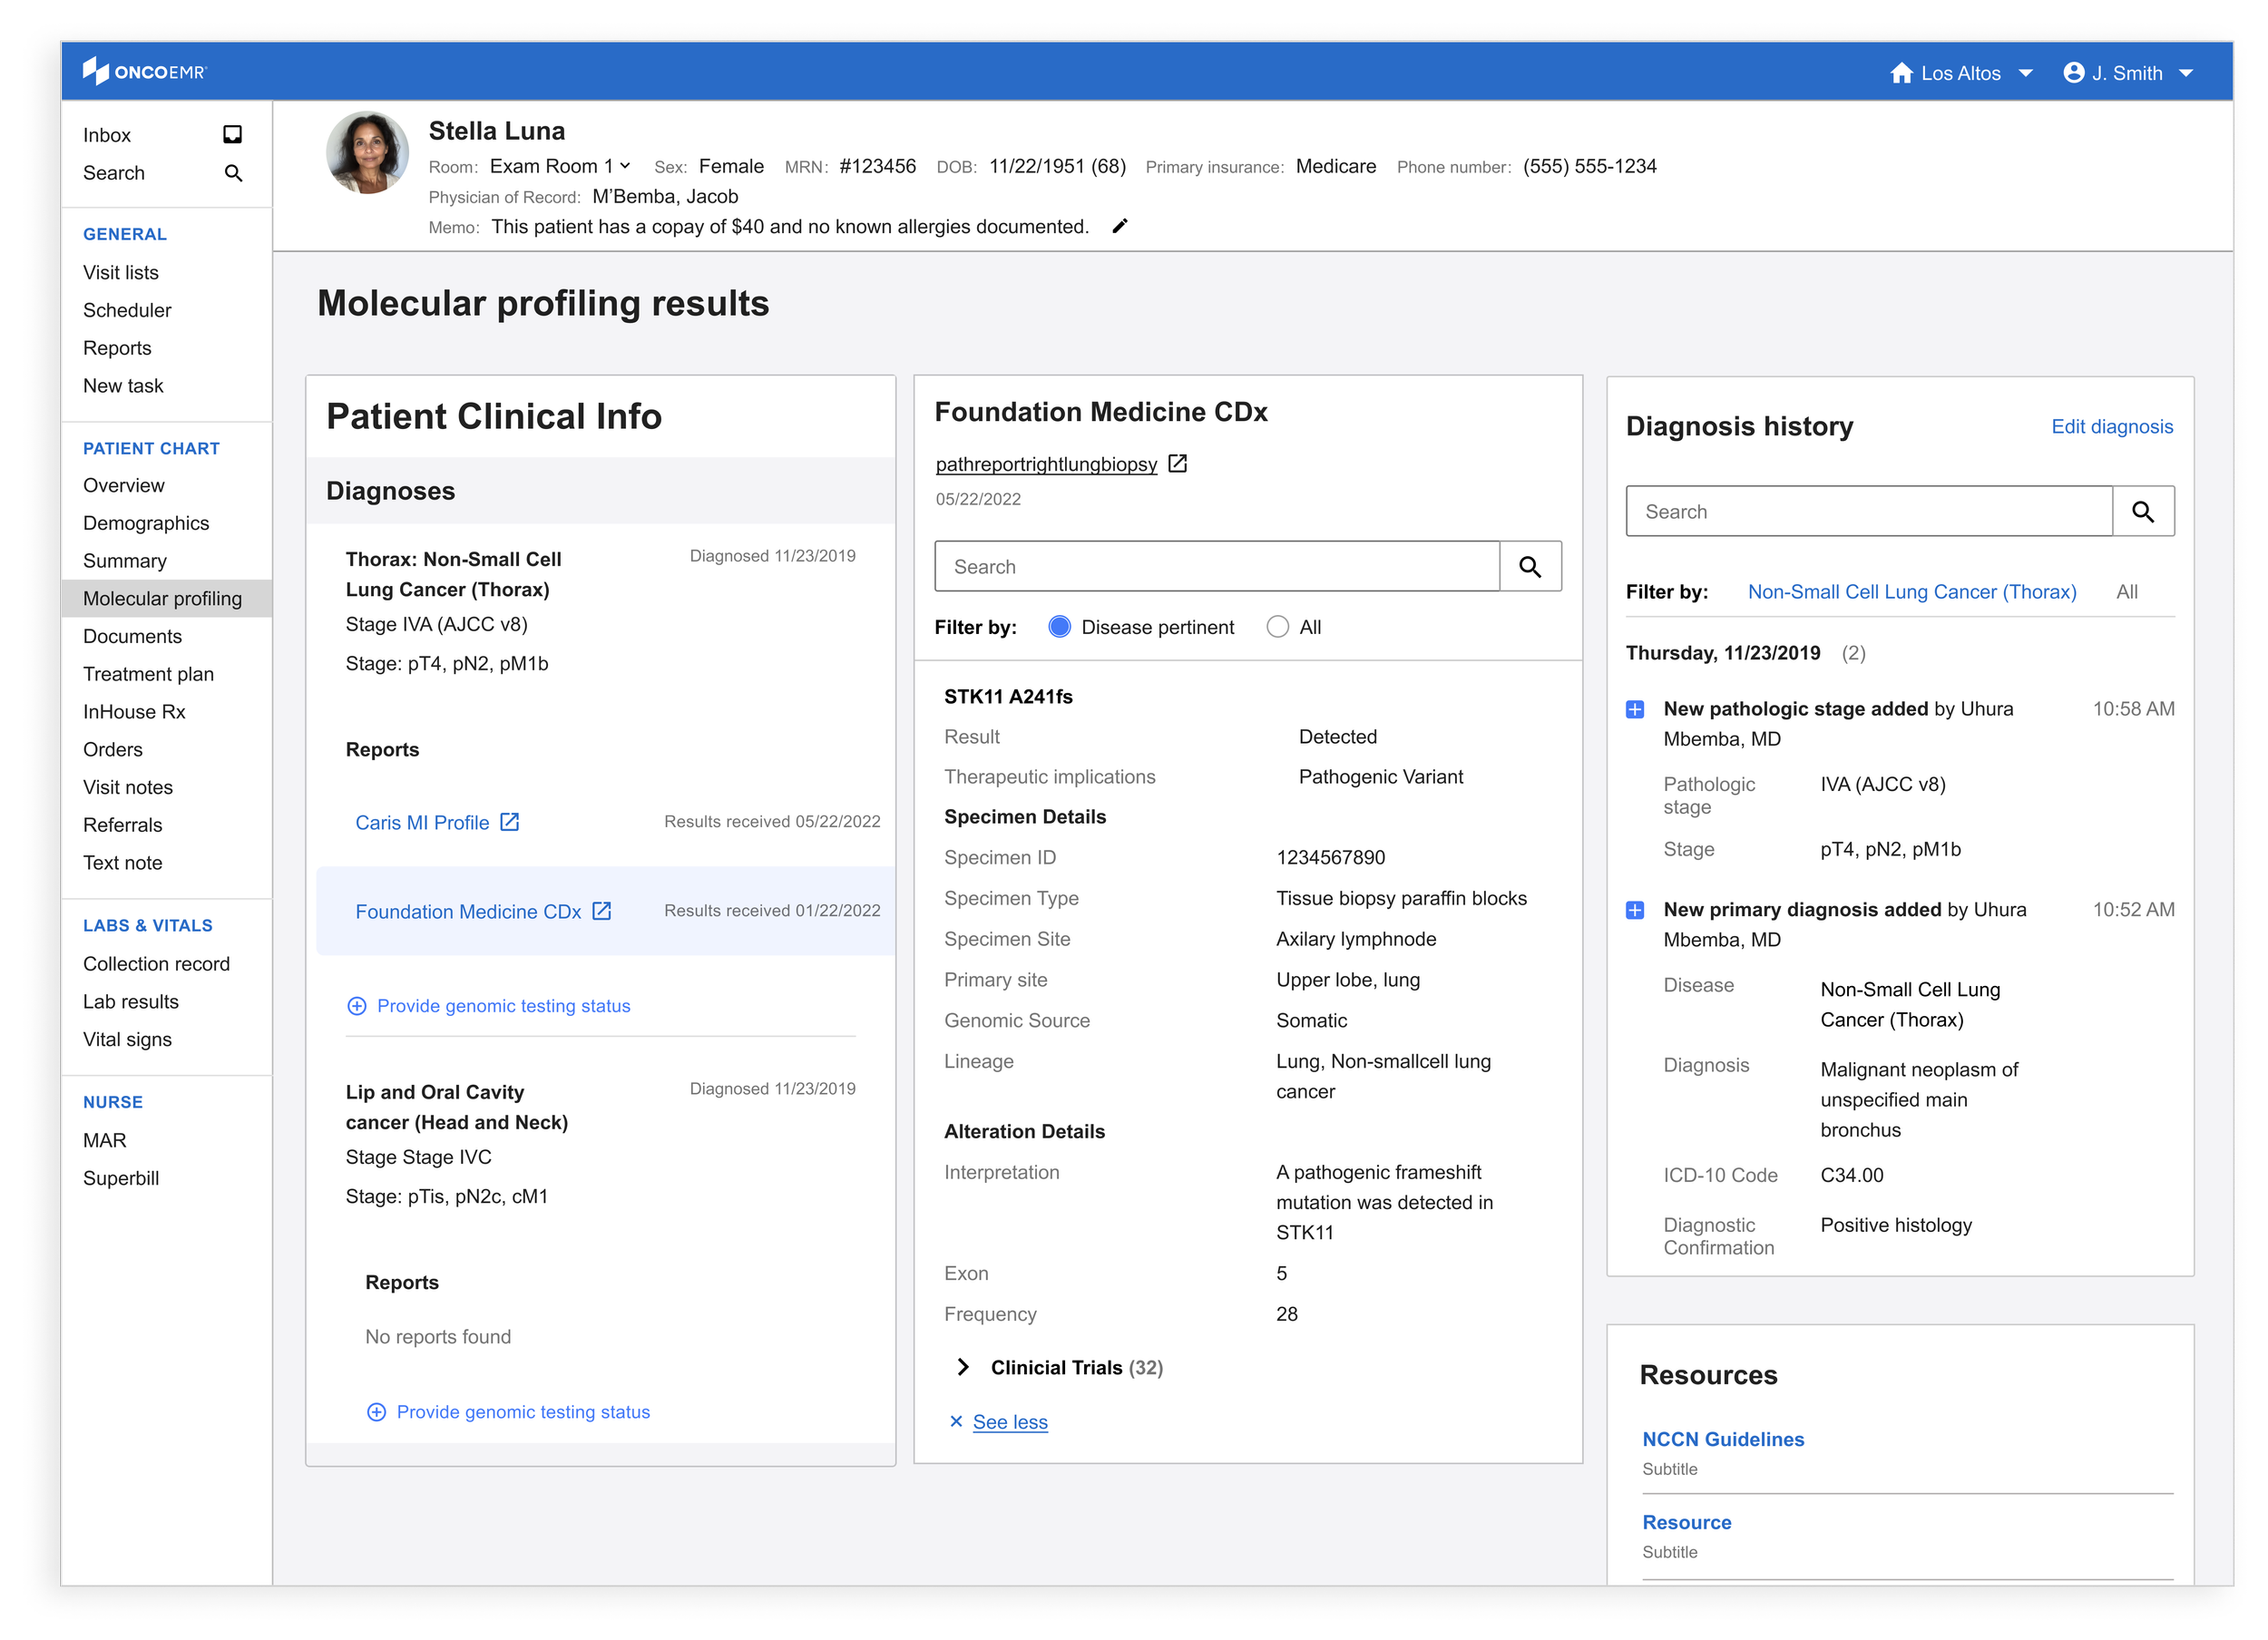
I also wanted to explore a design that got away from the traditional grid. This three column design integrates many of the same features listed above while creating a space to analyze multiple kinds of patient data in juxtaposition to the biomarker results. While this may have been one of my favorite iterations (and tested decently well with internal clinical folks), it felt clear that most providers weren't ready to abandon the more traditional way of reviewing these results yet
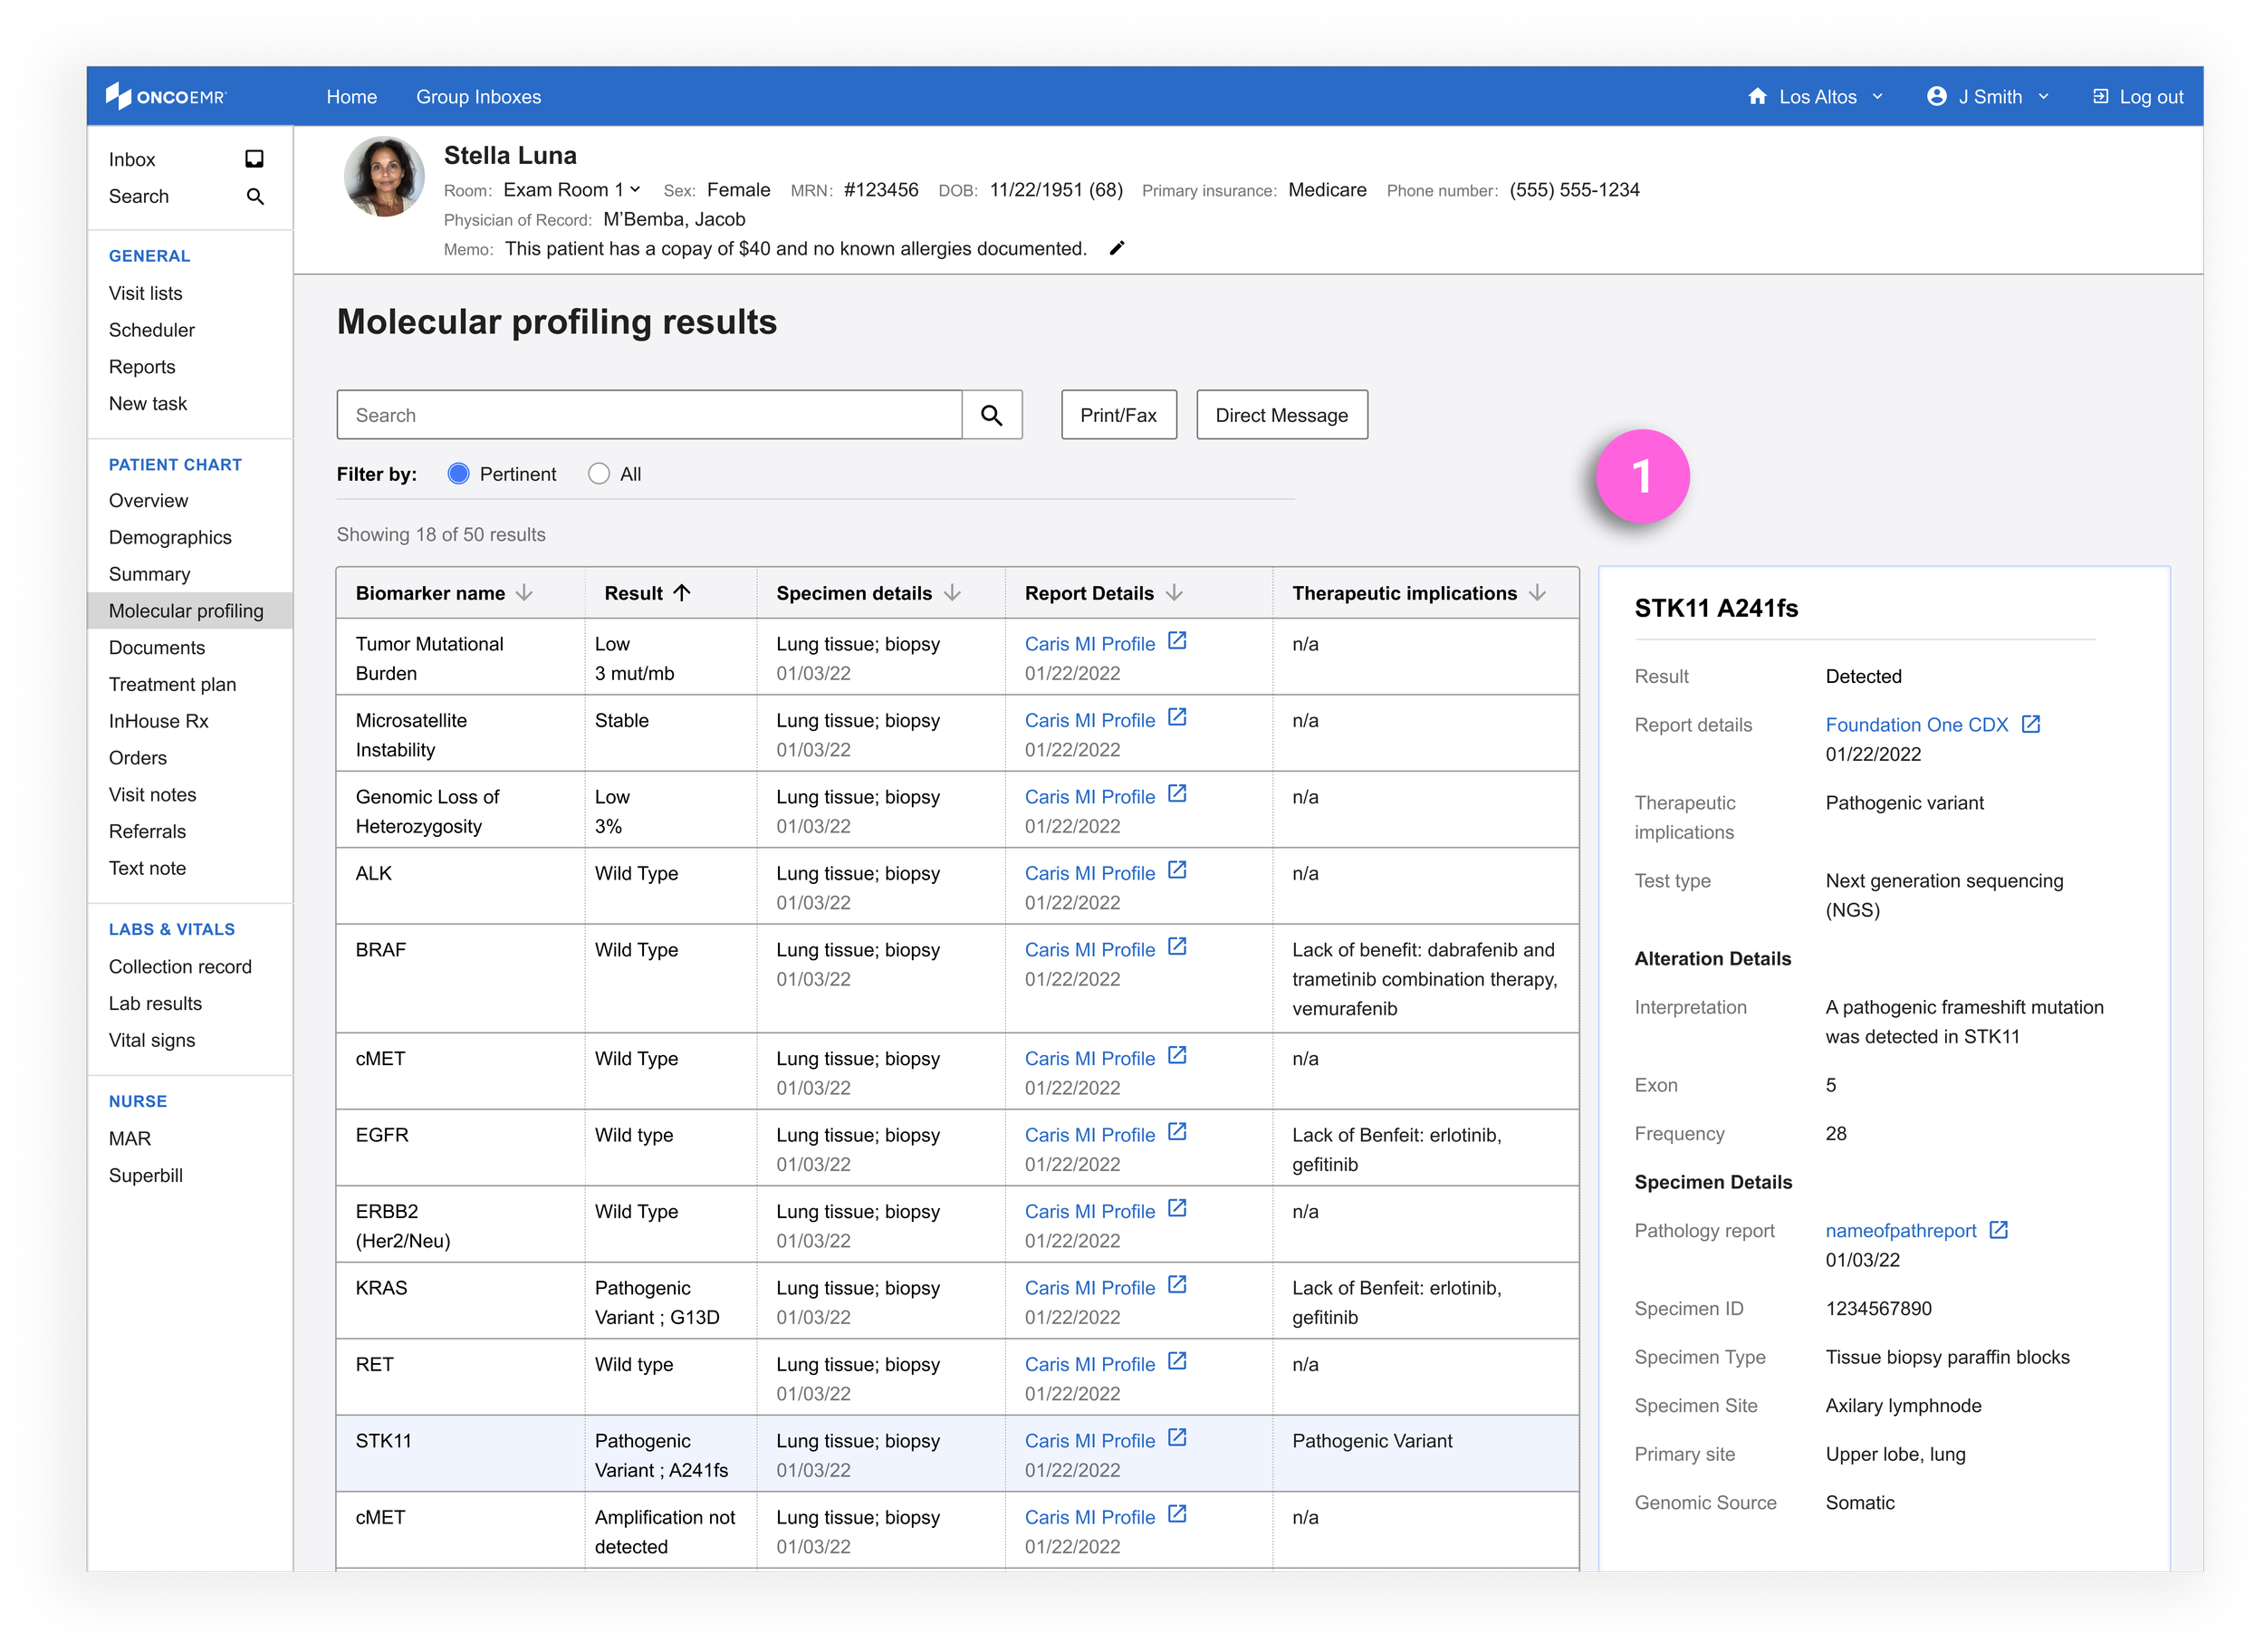
After an initial review with engineering where I was told the number of features far outstripped our capabilities, I worked with the clinical member of my team to decide what to cut and what to emphasize.
Keep: Search and filter, biomarker table with metadata
Eliminate: Diagnosis history, enter a new result, certain filter options
Addition: Details panel (1), a feature that allows the user to click on any result and see more granular information about the biomarker. I brought this concept forward from the three column design as a way for clinicians to better understand results without leaving the page
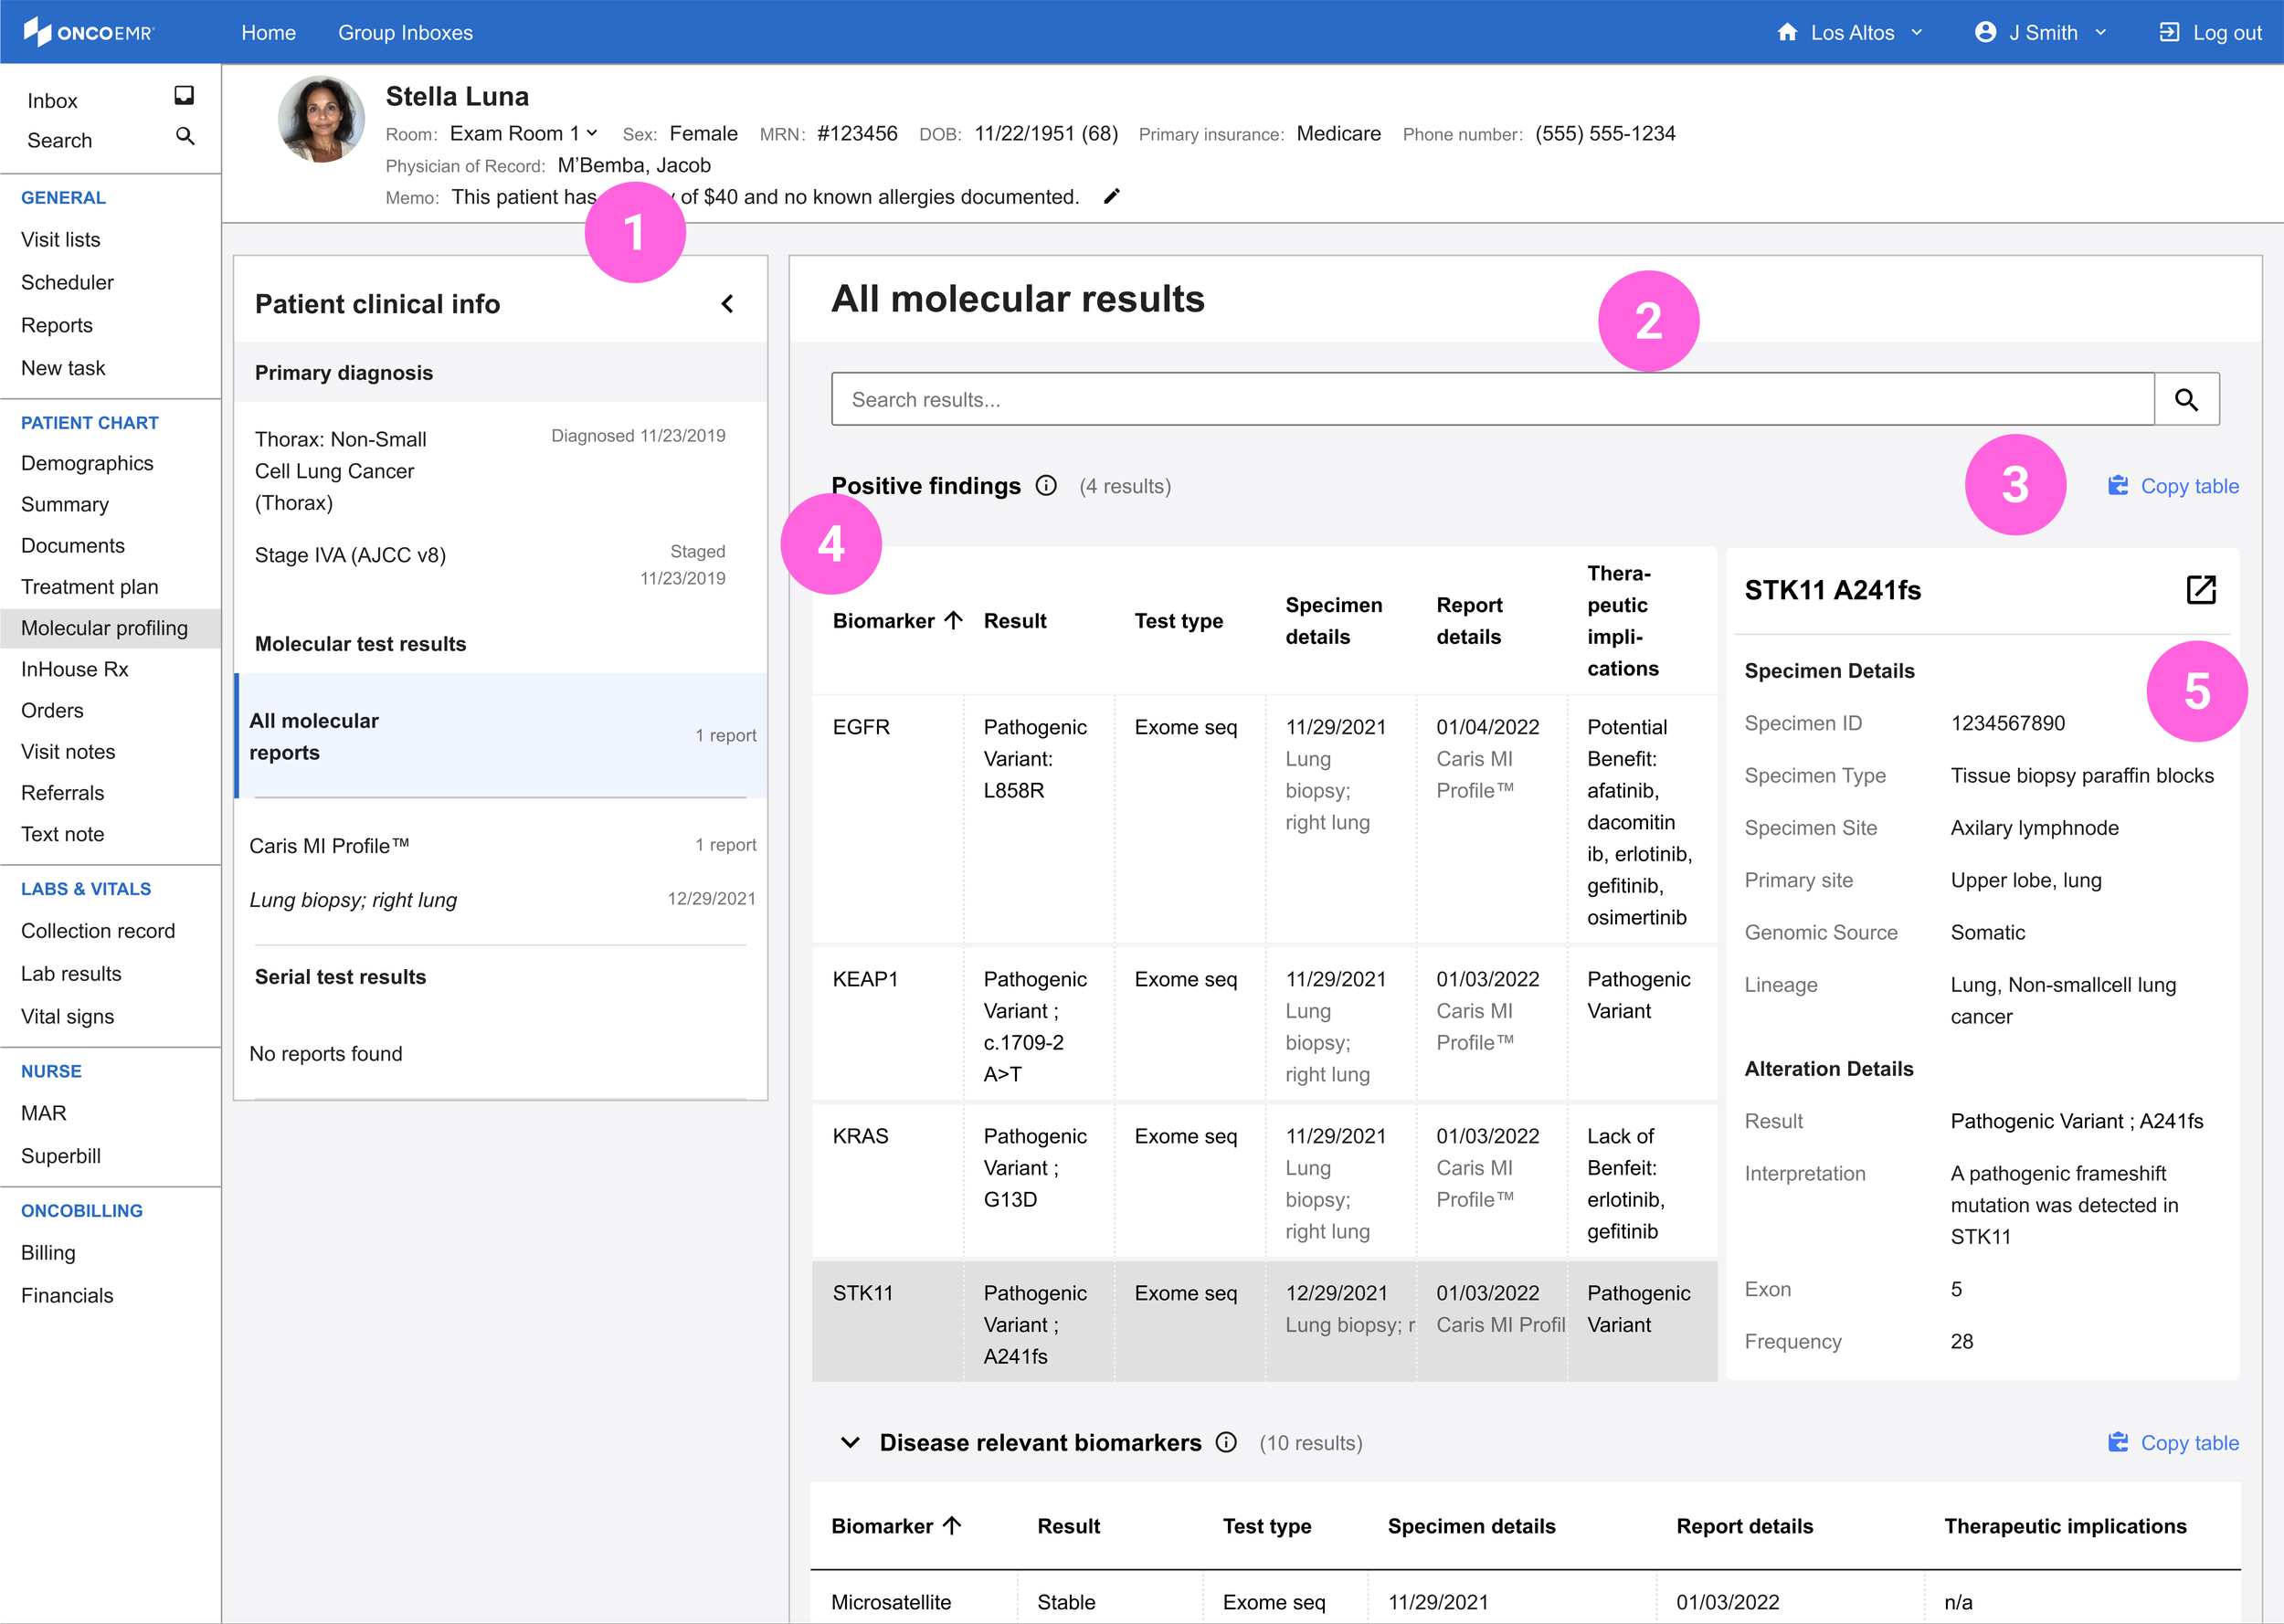
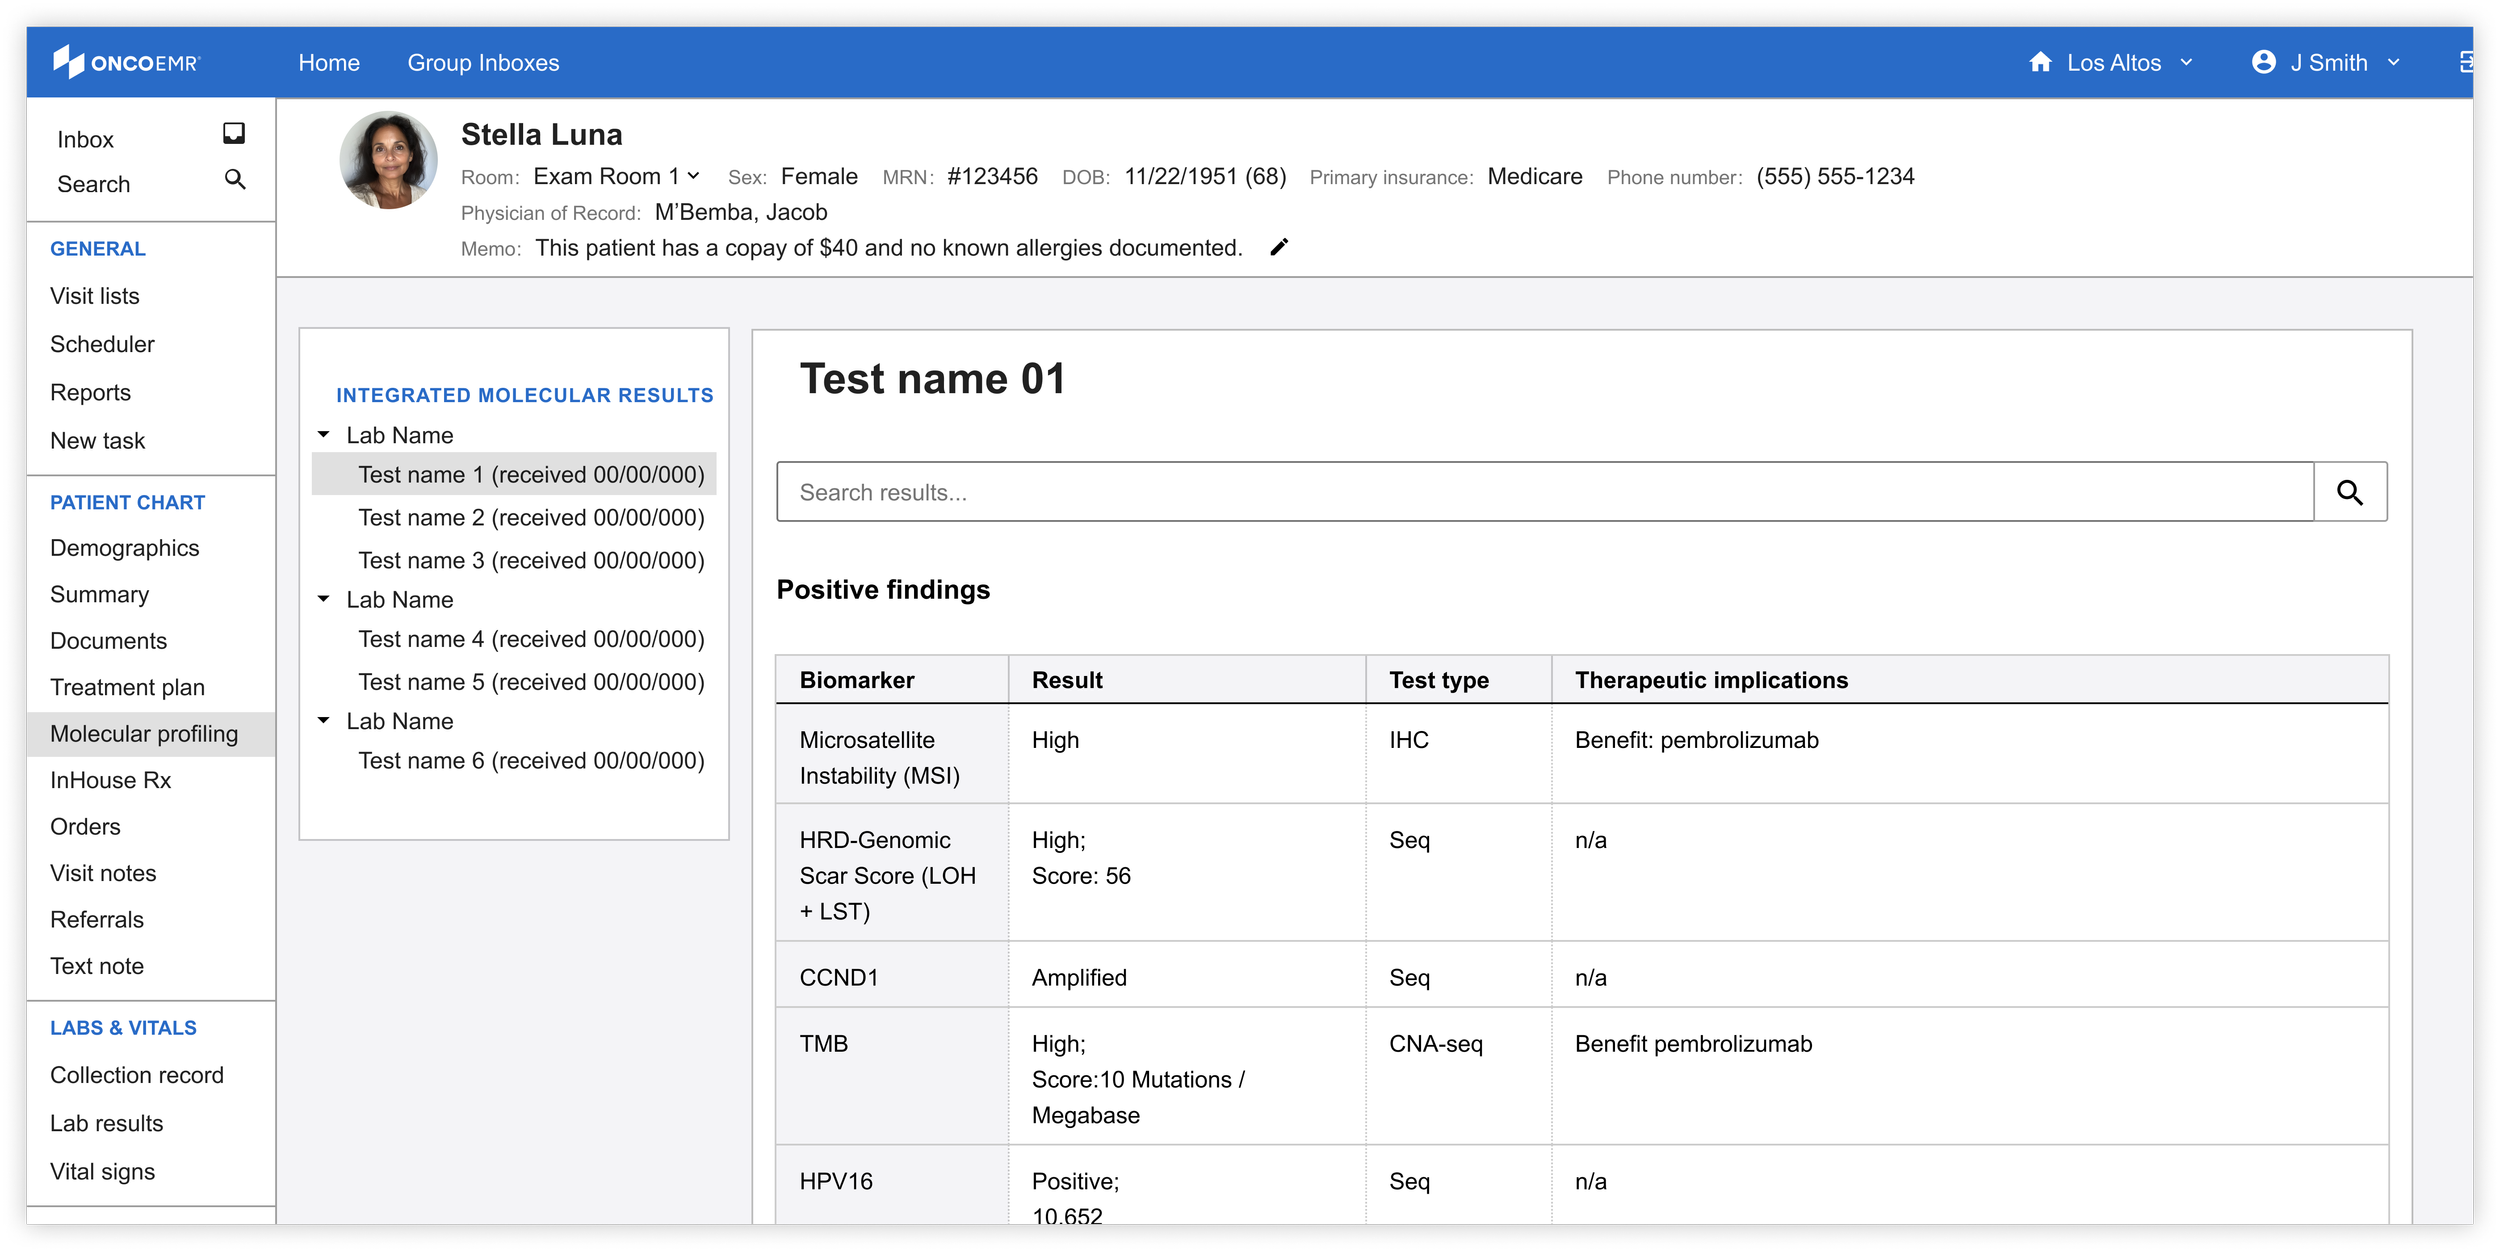
After another round of QA with both clinical and engineering, the shape of the molecular profiling homepage MVP (The MPH MVP, if you will) started to take shape:
(1) Navigation: A navigational side bar that contains the bare minimum of patient information and allows the user to navigate intuitively by test. I pulled this concept forward from the three-column design
(2) Search: Key word search that allows the user to look at specific biomarkers without scrolling
(3) Copy table: The ability to copy certain biomarker results tables to add to the note or anywhere else in the patient chart
(4) Biomarker curation: Separate, clinically curated tables that sort the results into categories to help them make sense of the report
(5) Details panel: Granular details about any selected biomarker in the table
A Proof of Concept
Eliminate: Details panel, copy table
Keep: Biomarker curation, navigation, search
In the summer of 2023, nearly a year after we had put the project on pause, we had the opportunity to devote some engineering capacity to the molecular profiling homepage. Our team took on a talented intern who was excited to tackle the unique challenge. In order to appropriately size this project for the time and skill level of the intern, I worked with the clinical team to strip even more features from the page, limit the design to components that already existed in our design system and create a true minimum product that we'd be comfortable launching. While the page was bare, it represented a true proof of concept for the idea.
Launch
A full year passed before we were able to refocus our resources on the MPH. With additional engineering capacity and demand for structured data growing, I worked with the product manager and clinical lead on my team to design a limited beta that we could launch with a few doctors. In order to evolve our proof of concept into a true MVP, I ran a prioritization workshop to help the team decide what we were going to focus on.
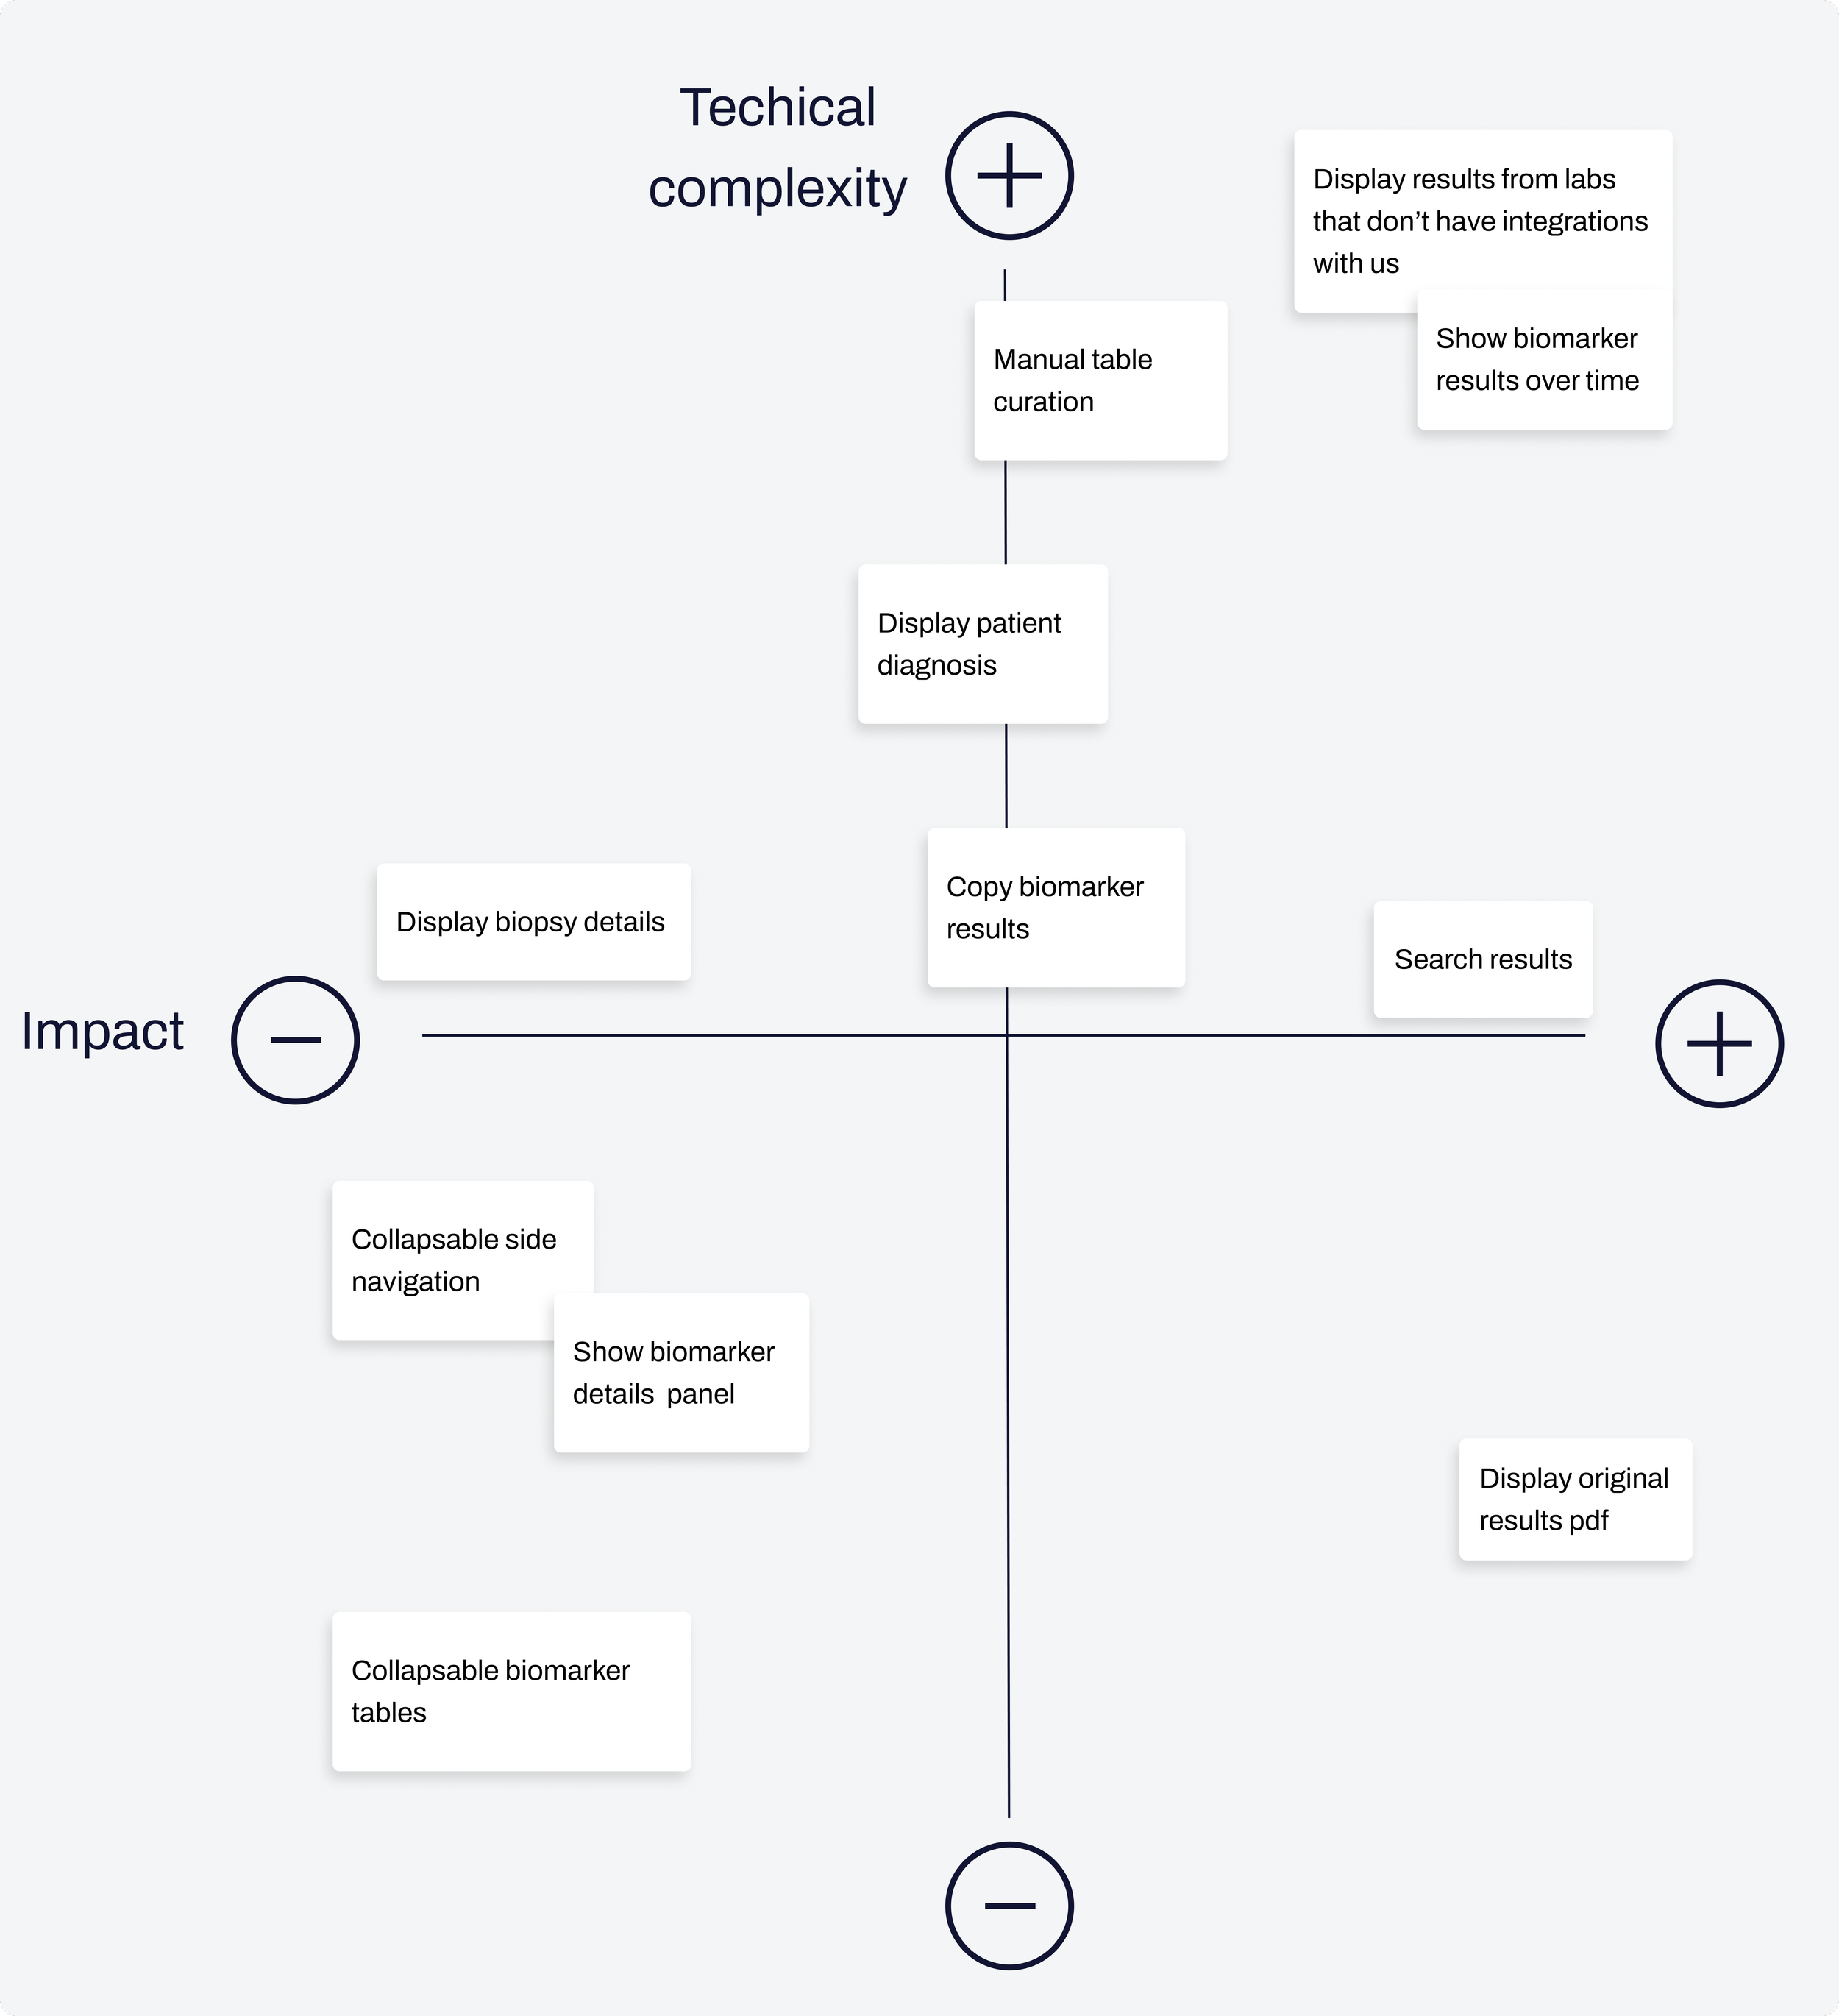
Using a 2x2 framework, I catalogued every feature we had considered over the course of designing the MPH, and as a team we plotted them against technical complexity and perceived impact on our users. Ultimately, only 3 features made the cut:
Search results: Users can use the search bar to find a specific biomarker across any report
Display the original results pdf: Users will always have one click access to the pdf report the lab sends over containing their interpretation of the results
Display results from labs that don't have integrations with us: The results in the MPH table can only come from integrated tests (tests for which we receive structured data). However, we wanted the MPH to contain all results regardless of whether they appear as structured. For these results, we decided to surface only the original pdf report
With our MVP defined, I worked alongside engineering to update the UX of the page to a 'ready to launch' state. The final product included updates to the side navigation bar for better usability, updates to table curation and formatting as well as the addition of empty states to account for some of the new scenarios introduced by the limitations of structured data.
Where we are now
As of Q1 2025 we have launched the MPH in a limited pilot with 5 providers. Along with tracking usage data and metrics, we have monthly conversations scheduled with each user to receive qualitative feedback on how the page is performing and serving their needs. So far we have had four conversation with our pilot users and the initial feedback is overwhelmingly positive. Other providers have been eager for us to expand the page's capabilities so they can make use of it more readily in their workflows.